Fig. 8.
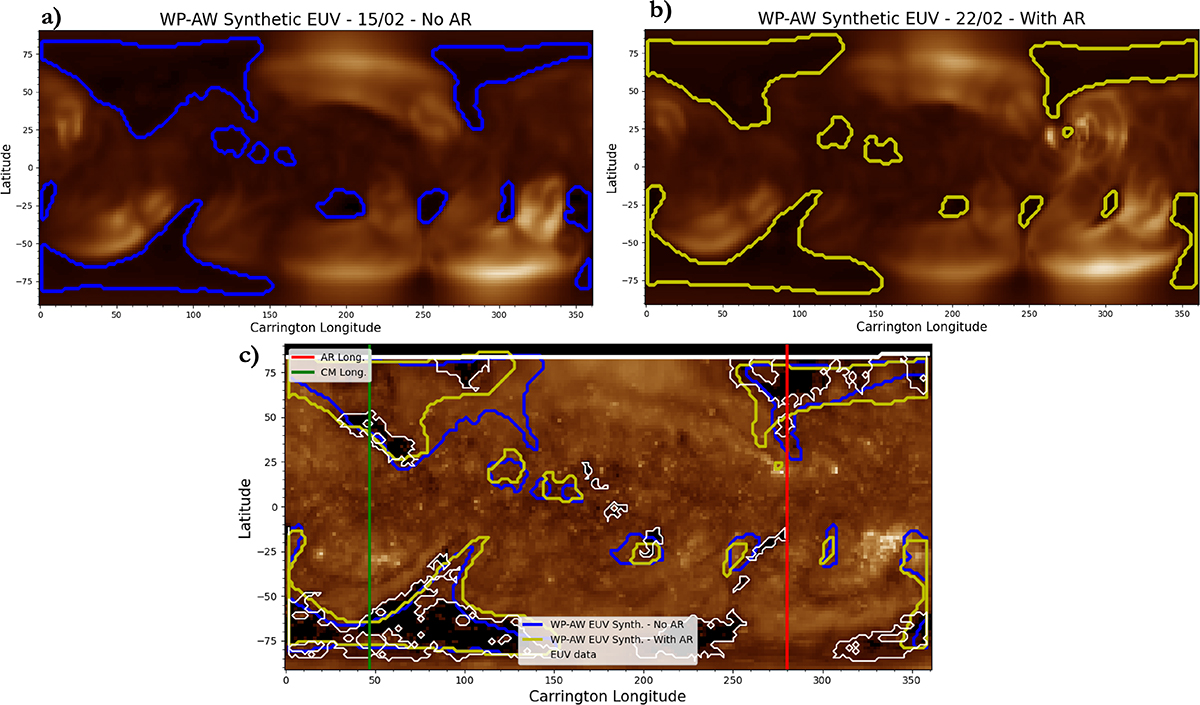
Download original image
Comparison of synthetic EUV emission from WP-AW (top row) with EUV synoptic maps from SDO/AIA-193A (bottom row). On the top row, the left panel shows the results using the magnetic map from February 15 without the AR (blue contours), while the right panel shows the results using the magnetic map from February 22 with the AR (yellow contours). On the bottom row, we use the same design as described in the last figure, where we compare contours from data (white) with WP-AW synthetic EUV contours without (blue) and with (yellow) the far-side AR. We also indicate the longitude corresponding to the AR on the far-side with a red line, and the longitude corresponding to the central meridian as seen from the Earth with a green line. The comparison is made with CR2240.
Current usage metrics show cumulative count of Article Views (full-text article views including HTML views, PDF and ePub downloads, according to the available data) and Abstracts Views on Vision4Press platform.
Data correspond to usage on the plateform after 2015. The current usage metrics is available 48-96 hours after online publication and is updated daily on week days.
Initial download of the metrics may take a while.