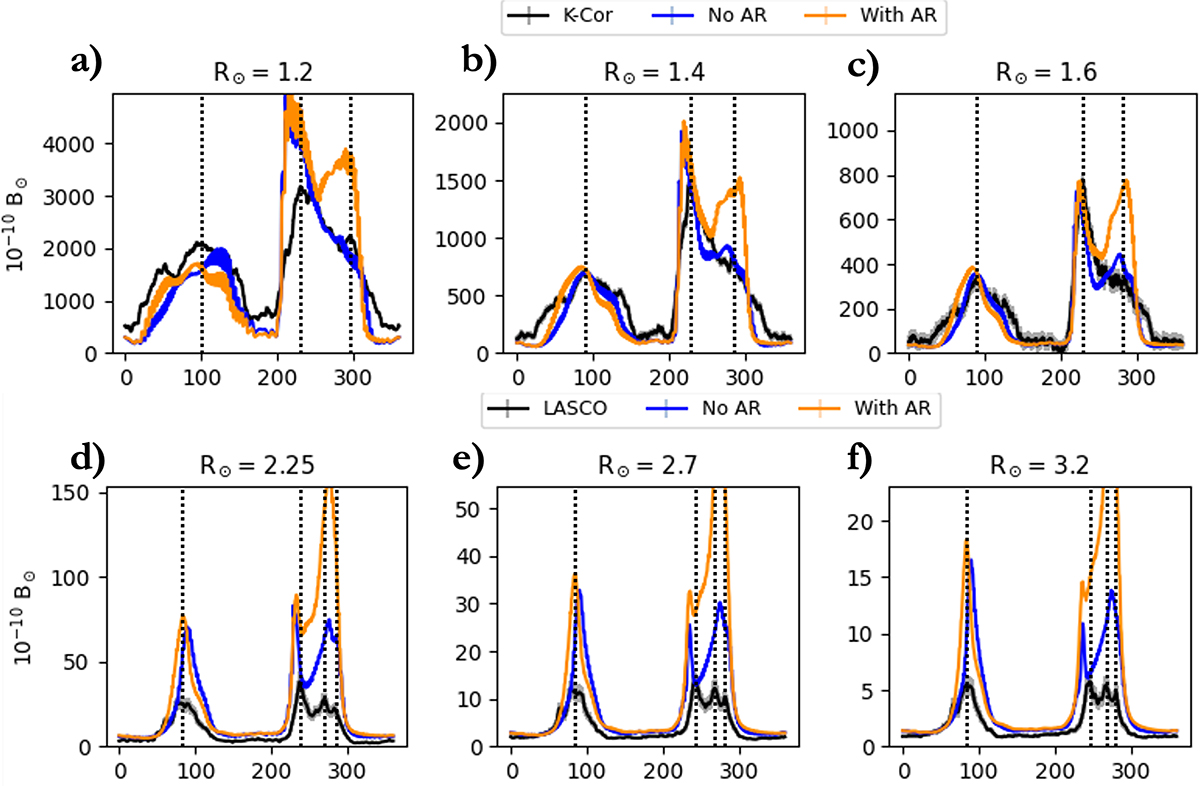
Fig. 6.
Download original image
Comparison of 1D cuts of the synthetic white-light emission from the WP-AW simulations with data from COSMO K-Cor (top line) and SOHO/LASCO C2 (bottom line) from February 15. Each panel shows the comparison at respectively 1.2, 1.4, 1.6, 2.25, 2.7 and 3.2 solar radii. The simulation with WP-AW of February 15 without the far-side AR is shown in blue, while the simulation of February 22 with the far-side AR is shown in orange. Data from K-Cor and LASCO is shown with a black line. The gray areas show the error bars associated with the data. The x-axis shows the position angle in degrees, with 0 being the north pole of the Sun and the angle progressing in clock-wise direction (so that the western limb is shown from 0 to 180 degrees, and the eastern limb is shown from 180 to 360 degrees). Streamer structures visible in the data are highlihgted using vertical dotted lines.
Current usage metrics show cumulative count of Article Views (full-text article views including HTML views, PDF and ePub downloads, according to the available data) and Abstracts Views on Vision4Press platform.
Data correspond to usage on the plateform after 2015. The current usage metrics is available 48-96 hours after online publication and is updated daily on week days.
Initial download of the metrics may take a while.