Fig. 4.
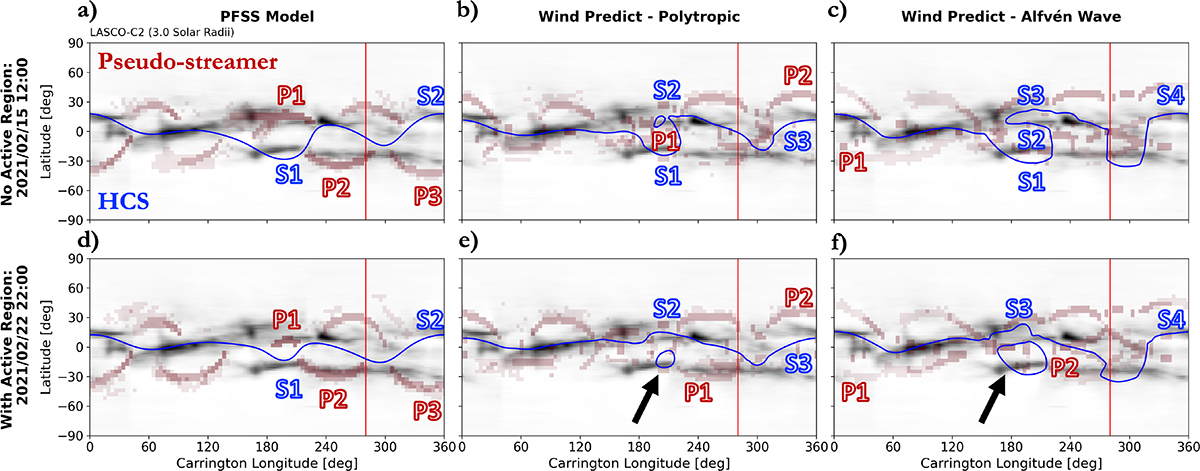
Download original image
Comparison between white-light pB synoptic maps and streamers extracted from simulations for models without (top row) and with (bottom row) the far-side AR. The background is a synoptic map made using LASCO/C2 white-light brightness images over the corresponding Carrington rotation (CR2240). With the chosen color scale, the SB appears as dark regions. The HCS extracted from simulations is shown as a blue line. The pseudo-streamers extracted from simulations are shown as reddish regions. The longitude of the far-side AR on February 15, 2021, is shown with a vertical red line. We keep the same nomenclature as in Fig. 3 for the identification of streamers and pseudo-streamers.
Current usage metrics show cumulative count of Article Views (full-text article views including HTML views, PDF and ePub downloads, according to the available data) and Abstracts Views on Vision4Press platform.
Data correspond to usage on the plateform after 2015. The current usage metrics is available 48-96 hours after online publication and is updated daily on week days.
Initial download of the metrics may take a while.