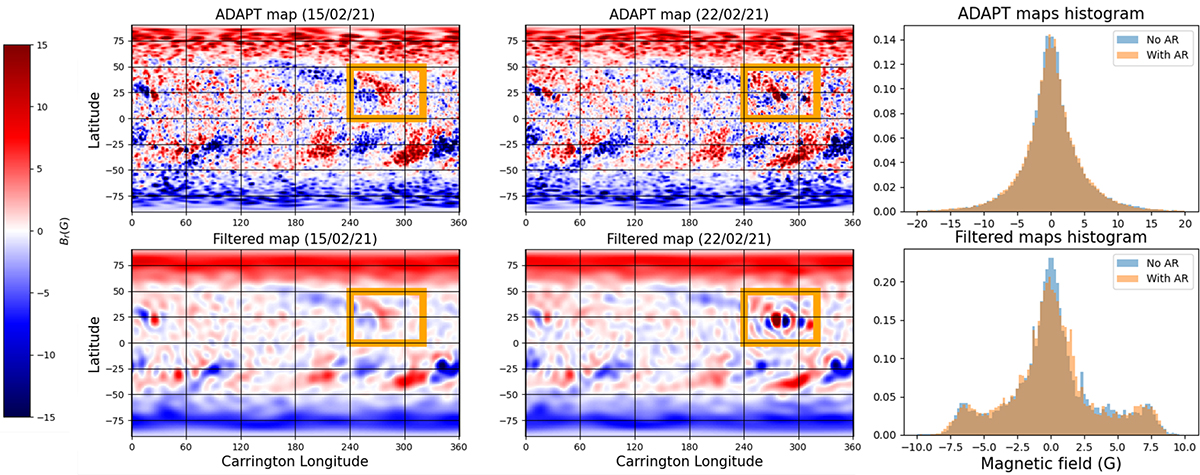
Fig. 2.
Download original image
Analysis of the magnetic input maps selected for the study. The left panels show the maps for February 15, 2021, and the middle panels the maps for February 22, 2021. The top row shows the original maps (both GONG-ADAPT maps in Carrington longitudes), while the bottom row shows the filtered maps used to initialize the simulations (spherical harmonics reconstruction up to ℓmax = 30). The far-side AR location is marked with an orange box. In the right panel is a histogram analysis of the radial magnetic field distribution for original (top) and filtered maps (bottom), without (blue) and with (orange) the far-side AR.
Current usage metrics show cumulative count of Article Views (full-text article views including HTML views, PDF and ePub downloads, according to the available data) and Abstracts Views on Vision4Press platform.
Data correspond to usage on the plateform after 2015. The current usage metrics is available 48-96 hours after online publication and is updated daily on week days.
Initial download of the metrics may take a while.