Fig. A.1.
Download original image
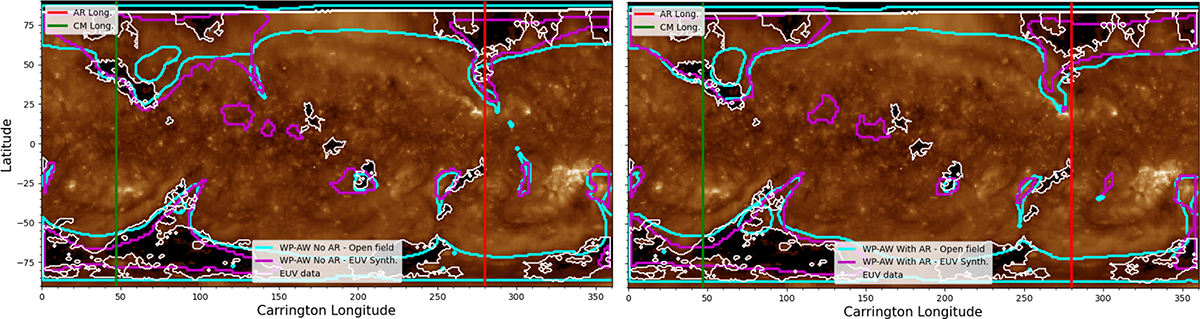
Comparison between coronal hole boundaries derived from open magnetic field lines (cyan) and synthetic EUV emissions (magenta). The left panel corresponds to the WP-AW simulation without the far-side AR (February 15), while the right panel corresponds to the WP-AW simulation with the far-side AR (February 22). Contours of the coronal holes extracted from the background SDO/AIA 193 Å EUV synoptic map are shown in white. We also indicate the longitude corresponding to the AR on the far-side with a red line, and the longitude corresponding to the central meridian as seen from the Earth with a green line. The comparison is made with CR2240.
Current usage metrics show cumulative count of Article Views (full-text article views including HTML views, PDF and ePub downloads, according to the available data) and Abstracts Views on Vision4Press platform.
Data correspond to usage on the plateform after 2015. The current usage metrics is available 48-96 hours after online publication and is updated daily on week days.
Initial download of the metrics may take a while.