Fig. A.1.
Download original image
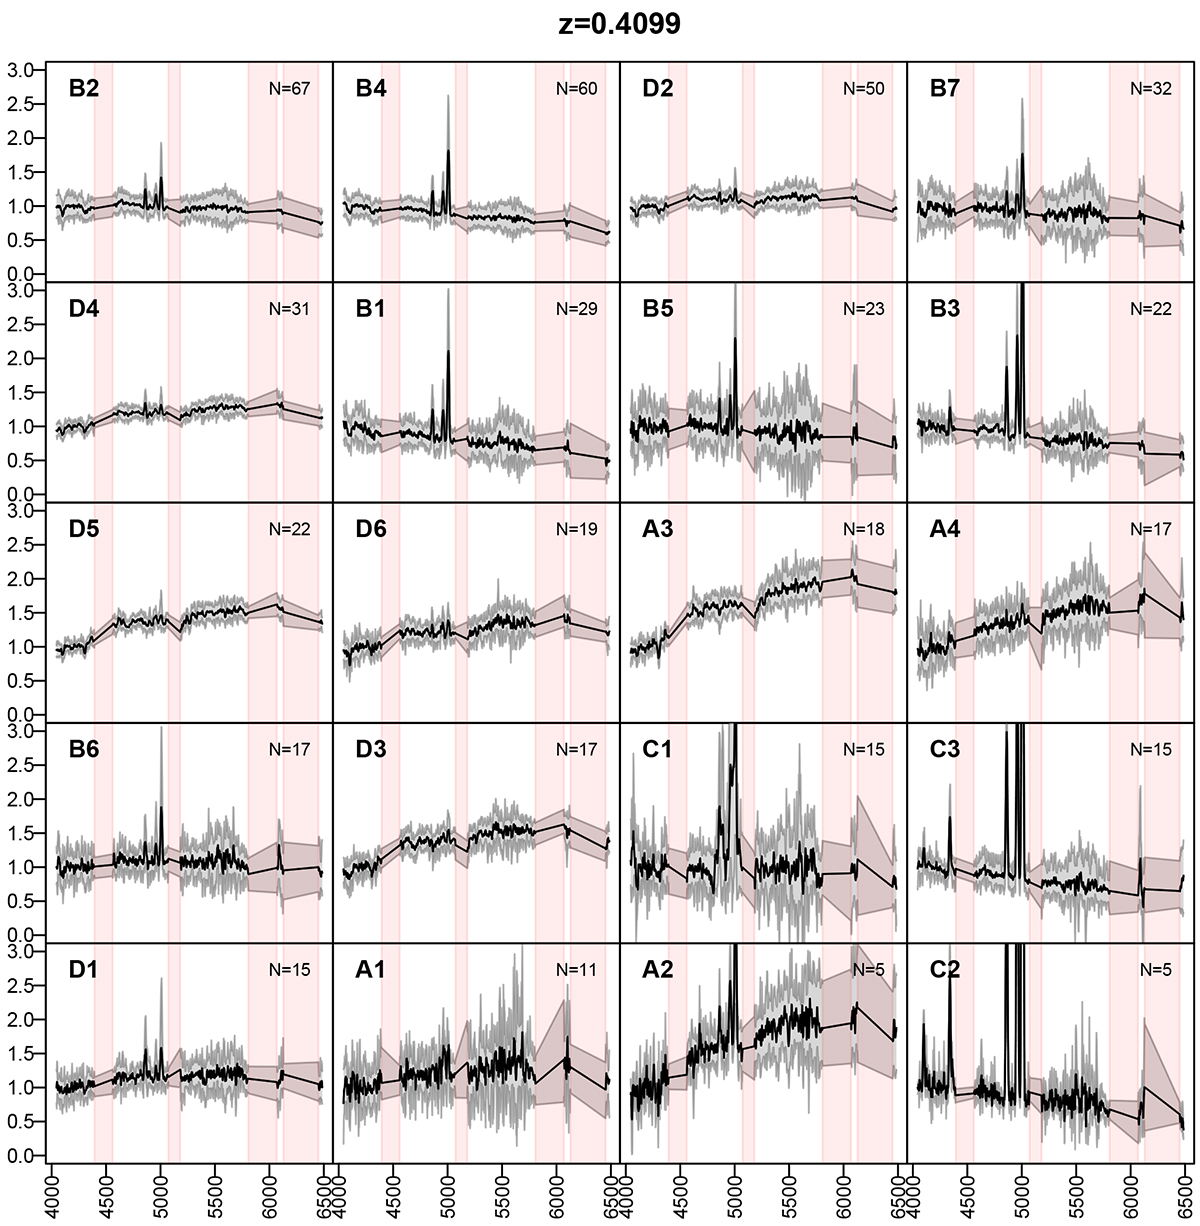
Mean spectra (black) of the classes obtained on the first bin at z = 0.41. The dispersion (10% and 90% quantiles) are shown in grey, and the masks are in red. Each panel shows one class, and the label is displayed in the top-left corner and size in the top right. The letter in the class label corresponds to the first run of the algorithm on this bin, and the number corresponds to the sub-classification of these main classes.
Current usage metrics show cumulative count of Article Views (full-text article views including HTML views, PDF and ePub downloads, according to the available data) and Abstracts Views on Vision4Press platform.
Data correspond to usage on the plateform after 2015. The current usage metrics is available 48-96 hours after online publication and is updated daily on week days.
Initial download of the metrics may take a while.