Open Access
Fig. 8.
Download original image
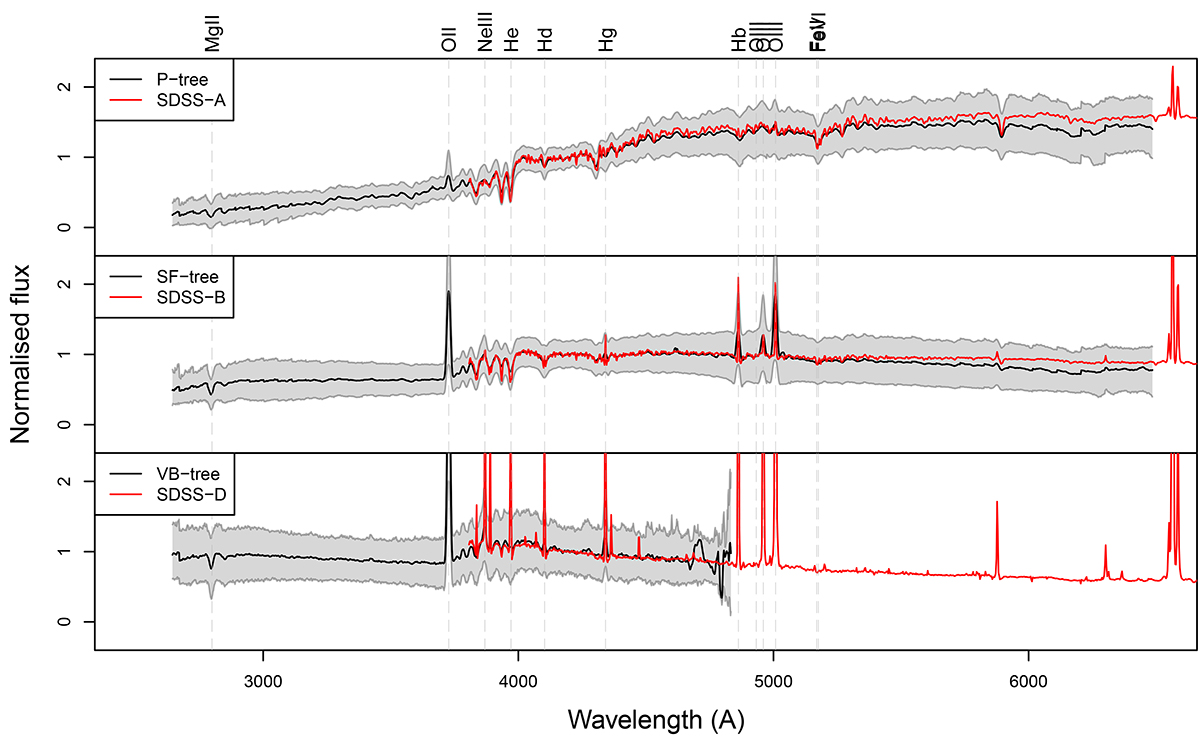
Same figure as in Fig. 3 but with an additional layer showing the mean spectra of the SDSS main classes A, B, and D. The SDSS spectra were re-normalised in the same spectral region than the VIPERS spectra to make the comparison possible.
Current usage metrics show cumulative count of Article Views (full-text article views including HTML views, PDF and ePub downloads, according to the available data) and Abstracts Views on Vision4Press platform.
Data correspond to usage on the plateform after 2015. The current usage metrics is available 48-96 hours after online publication and is updated daily on week days.
Initial download of the metrics may take a while.