Open Access
Fig. 5.
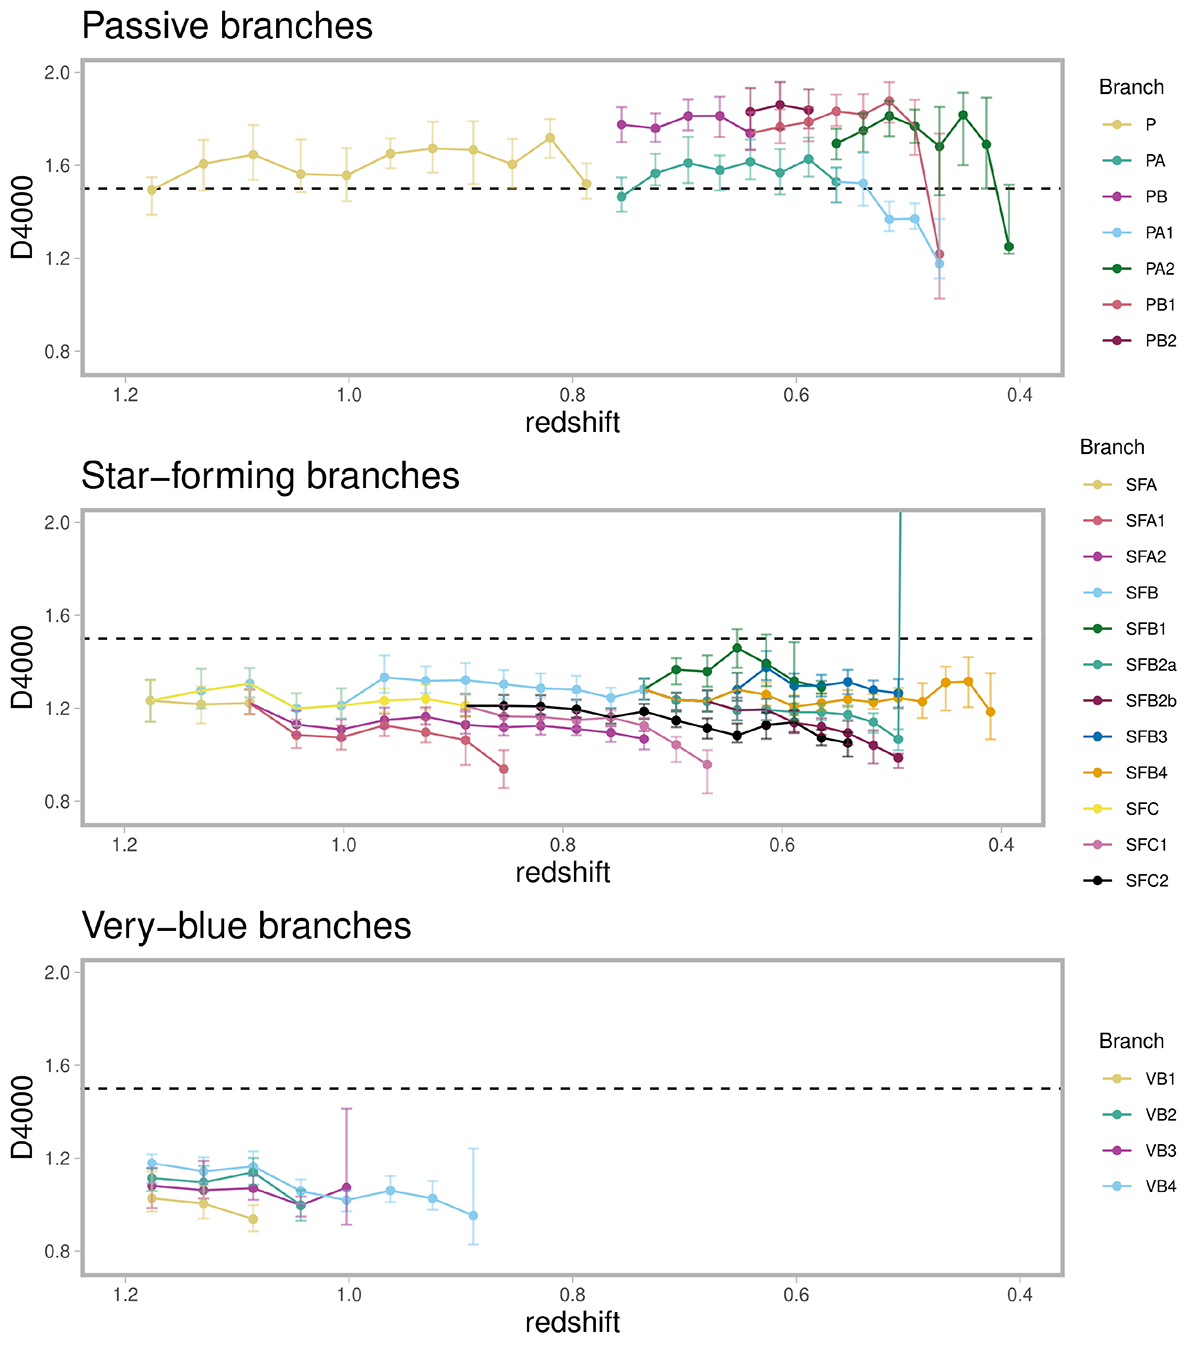
Download original image
Distribution of the median values of D4000 among the classes in the P, SF, and VB branches. The error bars show the 25% and 75% quantiles, and the dashed line shows the separation threshold between passive and star-forming galaxies from Kauffmann et al. (2003).
Current usage metrics show cumulative count of Article Views (full-text article views including HTML views, PDF and ePub downloads, according to the available data) and Abstracts Views on Vision4Press platform.
Data correspond to usage on the plateform after 2015. The current usage metrics is available 48-96 hours after online publication and is updated daily on week days.
Initial download of the metrics may take a while.