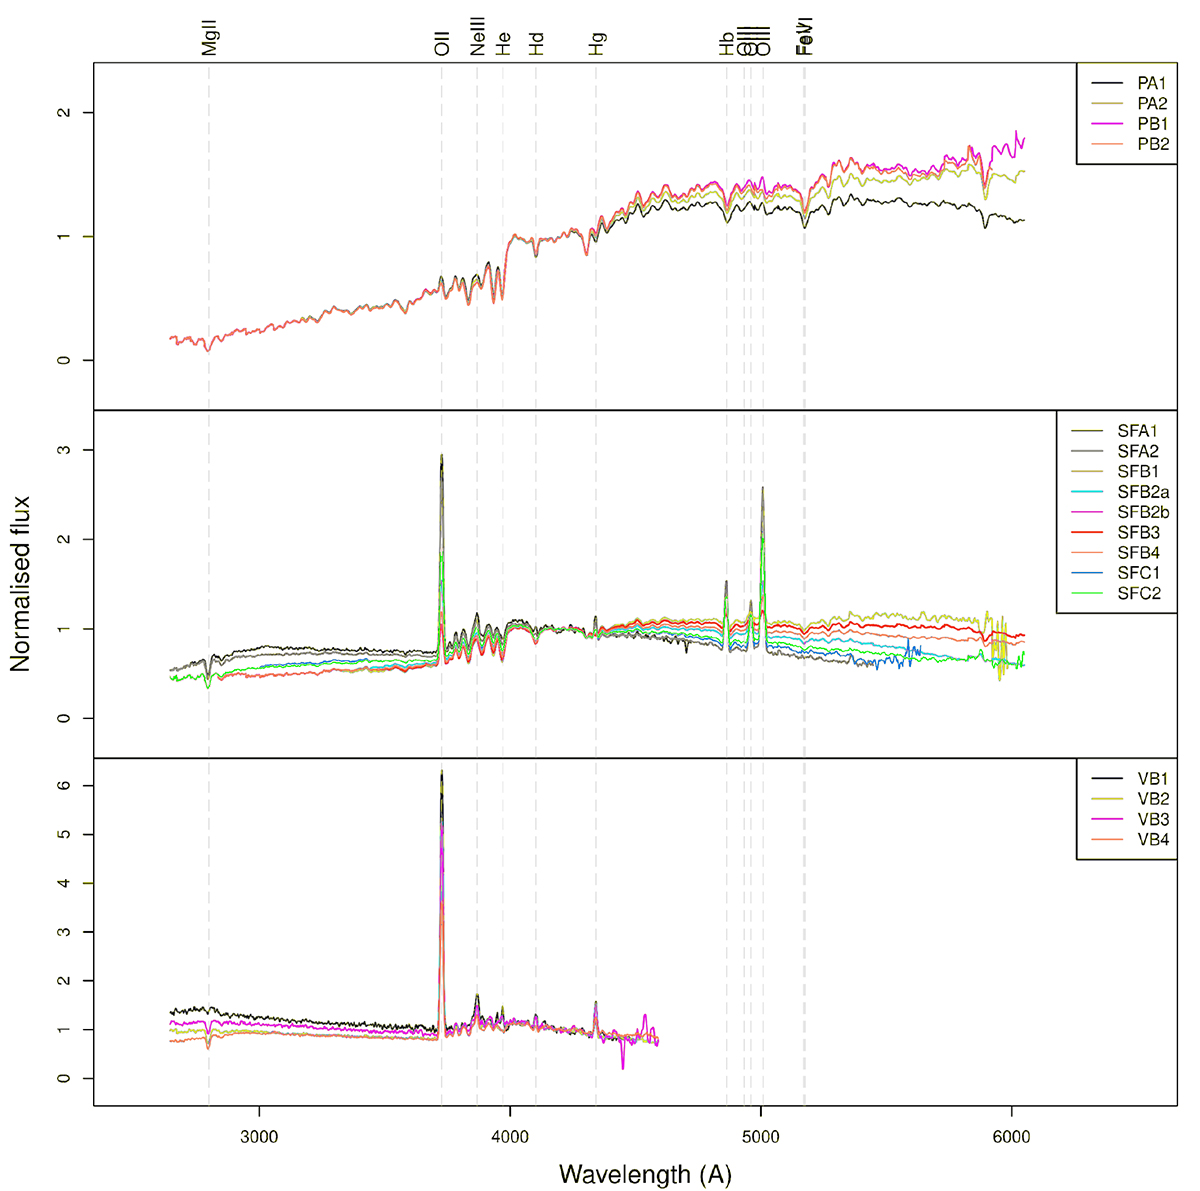
Fig. 4.
Download original image
Mean spectra of the branches within the P tree (top), SF tree (middle), and VB tree (bottom). The branch nomenclature can be visualised in Fig. 1. The mean spectra were computed from the very top of the branch down to the common root, so that for instance the mean spectrum of PA1 includes the PA and P sections. The dispersion is not shown here for the sake of clarity. Some observed emission and absorption lines are highlighted with vertical dashed lines, and the corresponding source is shown at the top. We note that the vertical scale varies from one panel to another to fully include the emission lines within the plot.
Current usage metrics show cumulative count of Article Views (full-text article views including HTML views, PDF and ePub downloads, according to the available data) and Abstracts Views on Vision4Press platform.
Data correspond to usage on the plateform after 2015. The current usage metrics is available 48-96 hours after online publication and is updated daily on week days.
Initial download of the metrics may take a while.