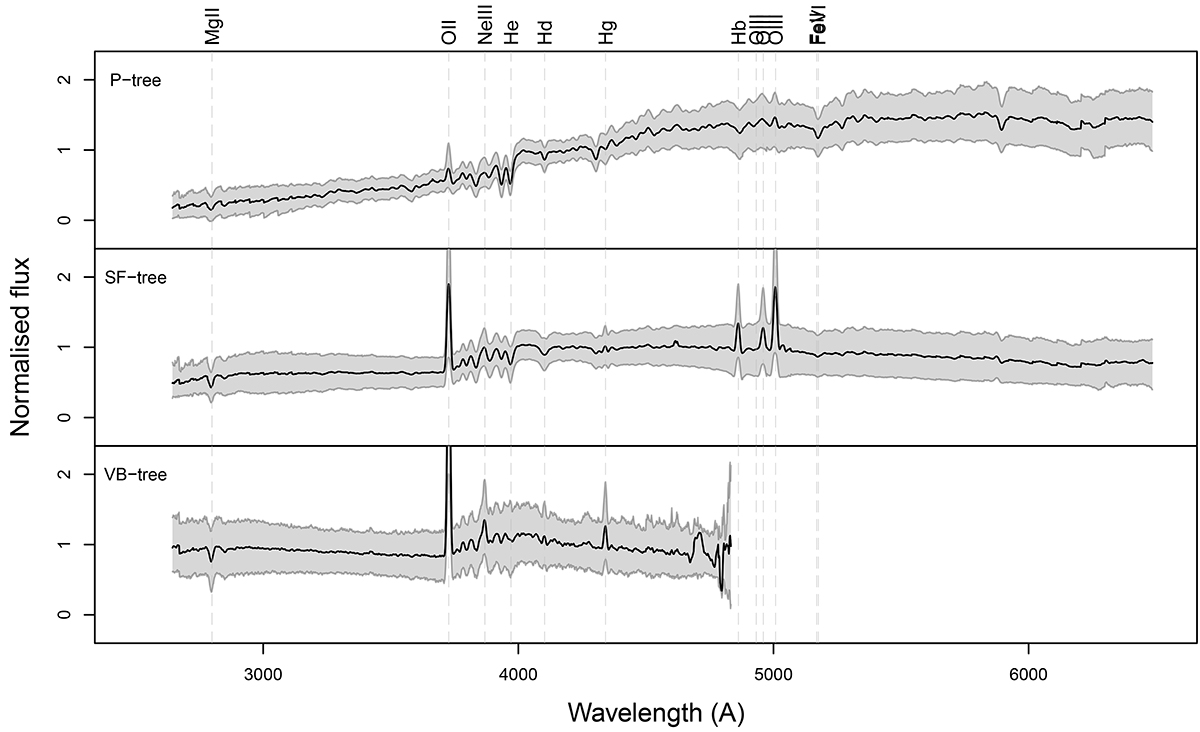
Fig. 3.
Download original image
Mean spectra (black) of the P tree (top), SF tree (middle), and VB tree (bottom). The dispersion (10% and 90% quantiles) are shown in grey. Some observed emission and absorption lines are highlighted with vertical dashed lines, and the corresponding source is shown at the top. We note that all three panels have the same vertical scale, and that OII line in the bottom panel is cropped out to focus on the continuum and the dispersion. The mean spectrum of the VB tree is limited to a narrower spectral range than the two other trees since it only includes galaxies of redshift z > 0.9.
Current usage metrics show cumulative count of Article Views (full-text article views including HTML views, PDF and ePub downloads, according to the available data) and Abstracts Views on Vision4Press platform.
Data correspond to usage on the plateform after 2015. The current usage metrics is available 48-96 hours after online publication and is updated daily on week days.
Initial download of the metrics may take a while.