Fig. 1.
Download original image
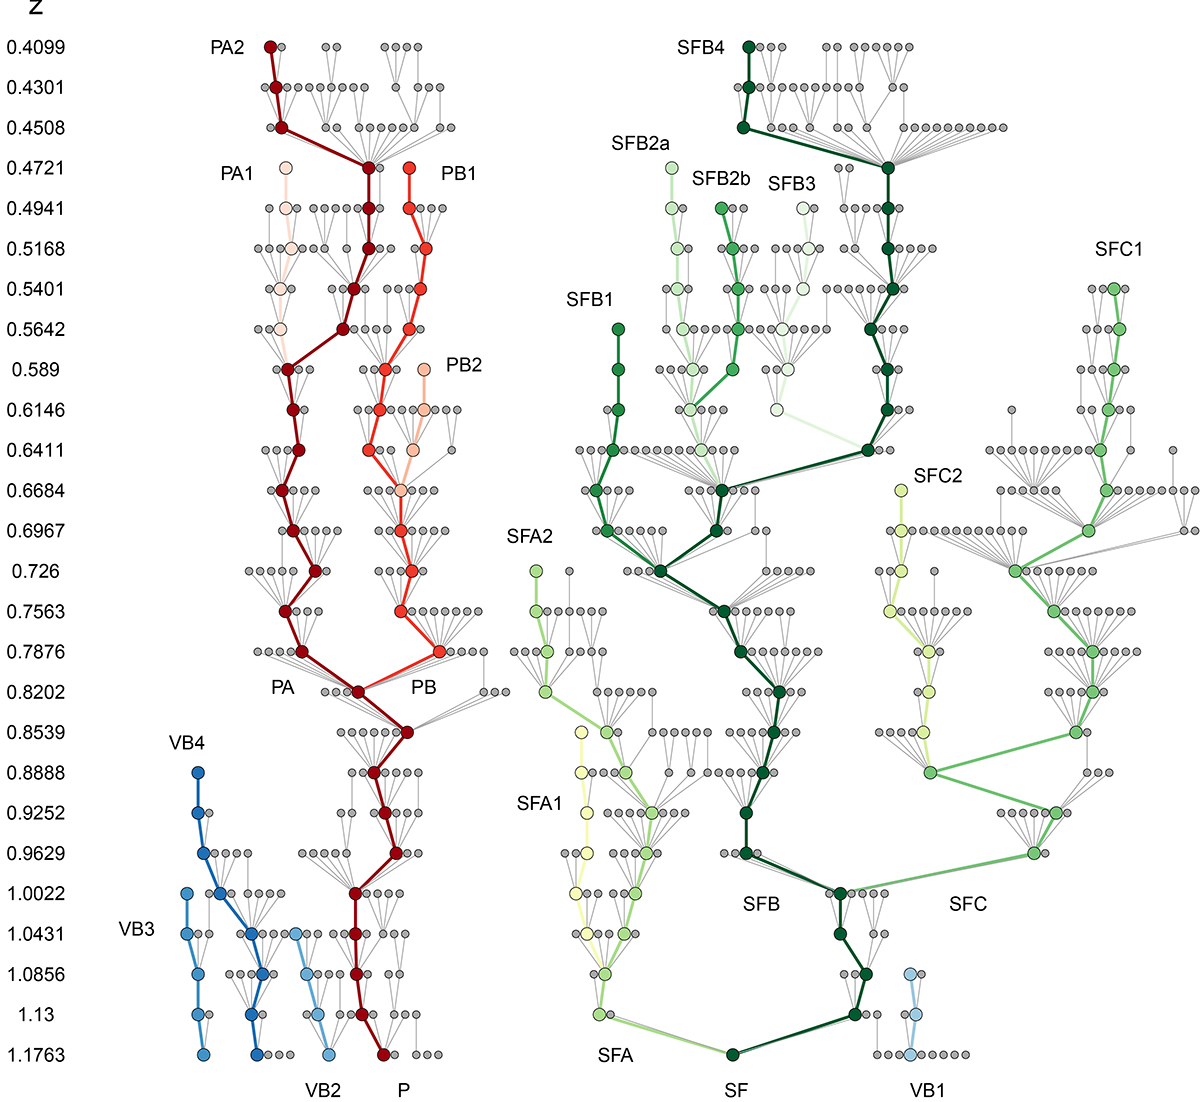
Tree-like structure highlighting the links between the galaxy classes from a redshift of z = 1.2 down to z = 0.4. The black line is the complete classification tree. Each vertical step in the tree corresponds to a certain epoch, linearly sampled from 4 Gyr after the Big Bang (bottom of the tree) to 9 Gyr (top of the tree). Each node represents a class, and similarity links from epoch to epoch were retrieved using KNN (Sect. 4.2). The branches that are studied in this paper as examples of spectral evolution are shown with a colour characteristics of their main branches: reds for passive galaxies (noted P*), greens for the star forming ones (SF*) and blues for the very blue spectra (VB*). The nomenclature is explained in the text.
Current usage metrics show cumulative count of Article Views (full-text article views including HTML views, PDF and ePub downloads, according to the available data) and Abstracts Views on Vision4Press platform.
Data correspond to usage on the plateform after 2015. The current usage metrics is available 48-96 hours after online publication and is updated daily on week days.
Initial download of the metrics may take a while.