Fig. B.1
Download original image
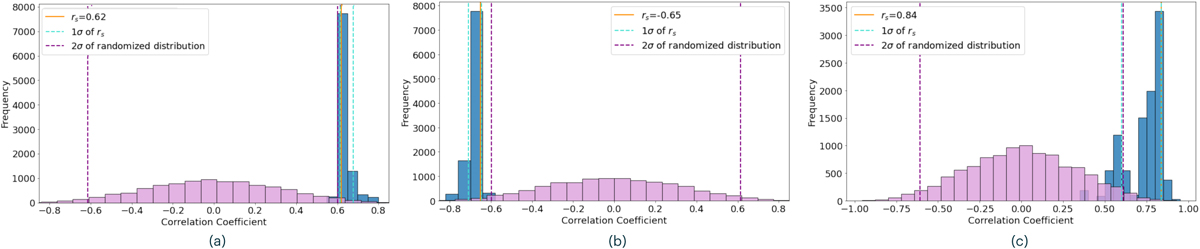
Correlation coefficient analysis for: (a) the ionization front radii and projected separation relation; (b) the ionization front radii and UV radiation relation; (c) mass-loss rate and UV radiation relation. The violet histogram corresponds to the bootstrapped randomized x-axis values; the dashed purple lines mark the 2σ ranges of the realizations. The blue histogram results from bootstrapping the y-axis values within the respective error bars, and the 1σ ranges of the bootstrap are shown with cyan line. We show that Spearman correlation coefficient for the measured data (orange line), which is outside 2σ of the randomized distribution.
Current usage metrics show cumulative count of Article Views (full-text article views including HTML views, PDF and ePub downloads, according to the available data) and Abstracts Views on Vision4Press platform.
Data correspond to usage on the plateform after 2015. The current usage metrics is available 48-96 hours after online publication and is updated daily on week days.
Initial download of the metrics may take a while.