Fig. 12
Download original image
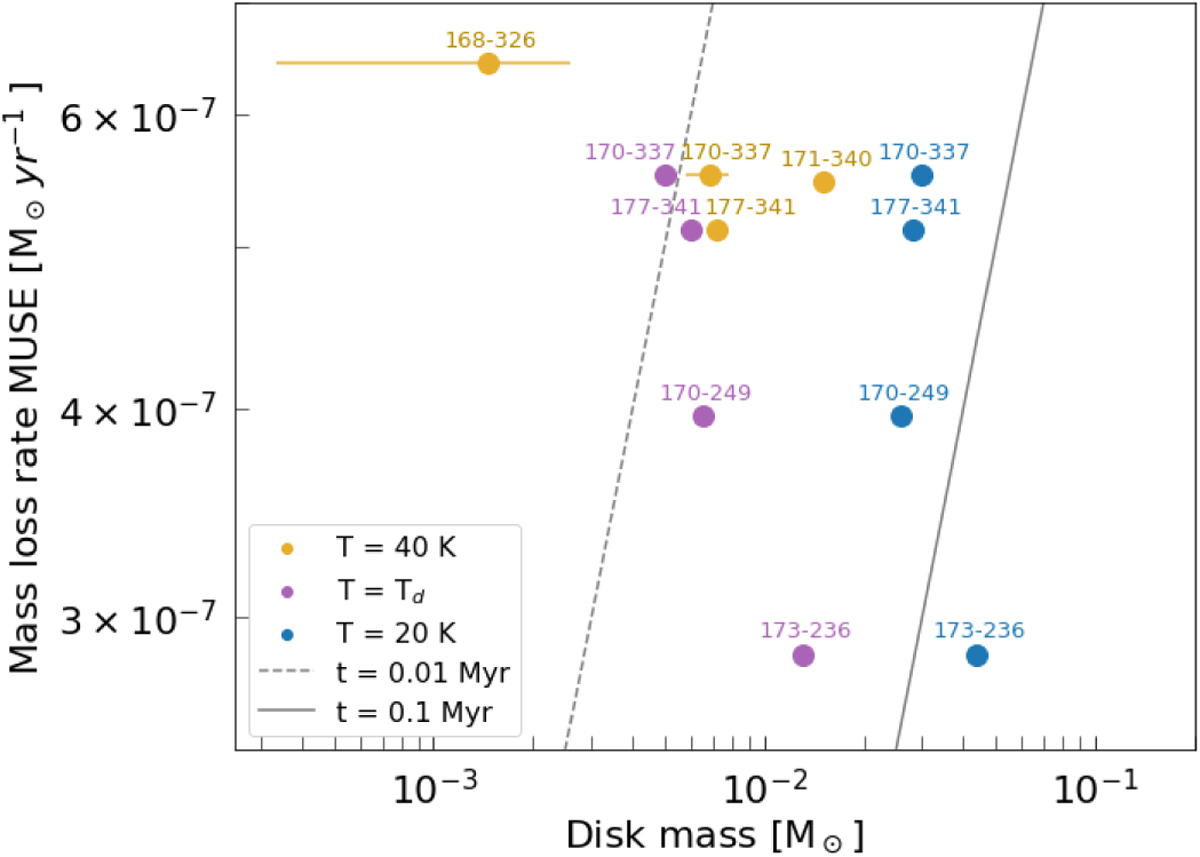
Mass-loss rates measured from the ionization front radius as a function of disk mass. The disk masses found by Mann et al. (2014) partly overlap with those reported by Ballering et al. (2023). Each colour represents a different assumed dust temperature: T = 20 K, T = 40 K, and Td = 62–108 K, and diagonal lines mark lifetimes.
Current usage metrics show cumulative count of Article Views (full-text article views including HTML views, PDF and ePub downloads, according to the available data) and Abstracts Views on Vision4Press platform.
Data correspond to usage on the plateform after 2015. The current usage metrics is available 48-96 hours after online publication and is updated daily on week days.
Initial download of the metrics may take a while.