Open Access
Fig. 10
Download original image
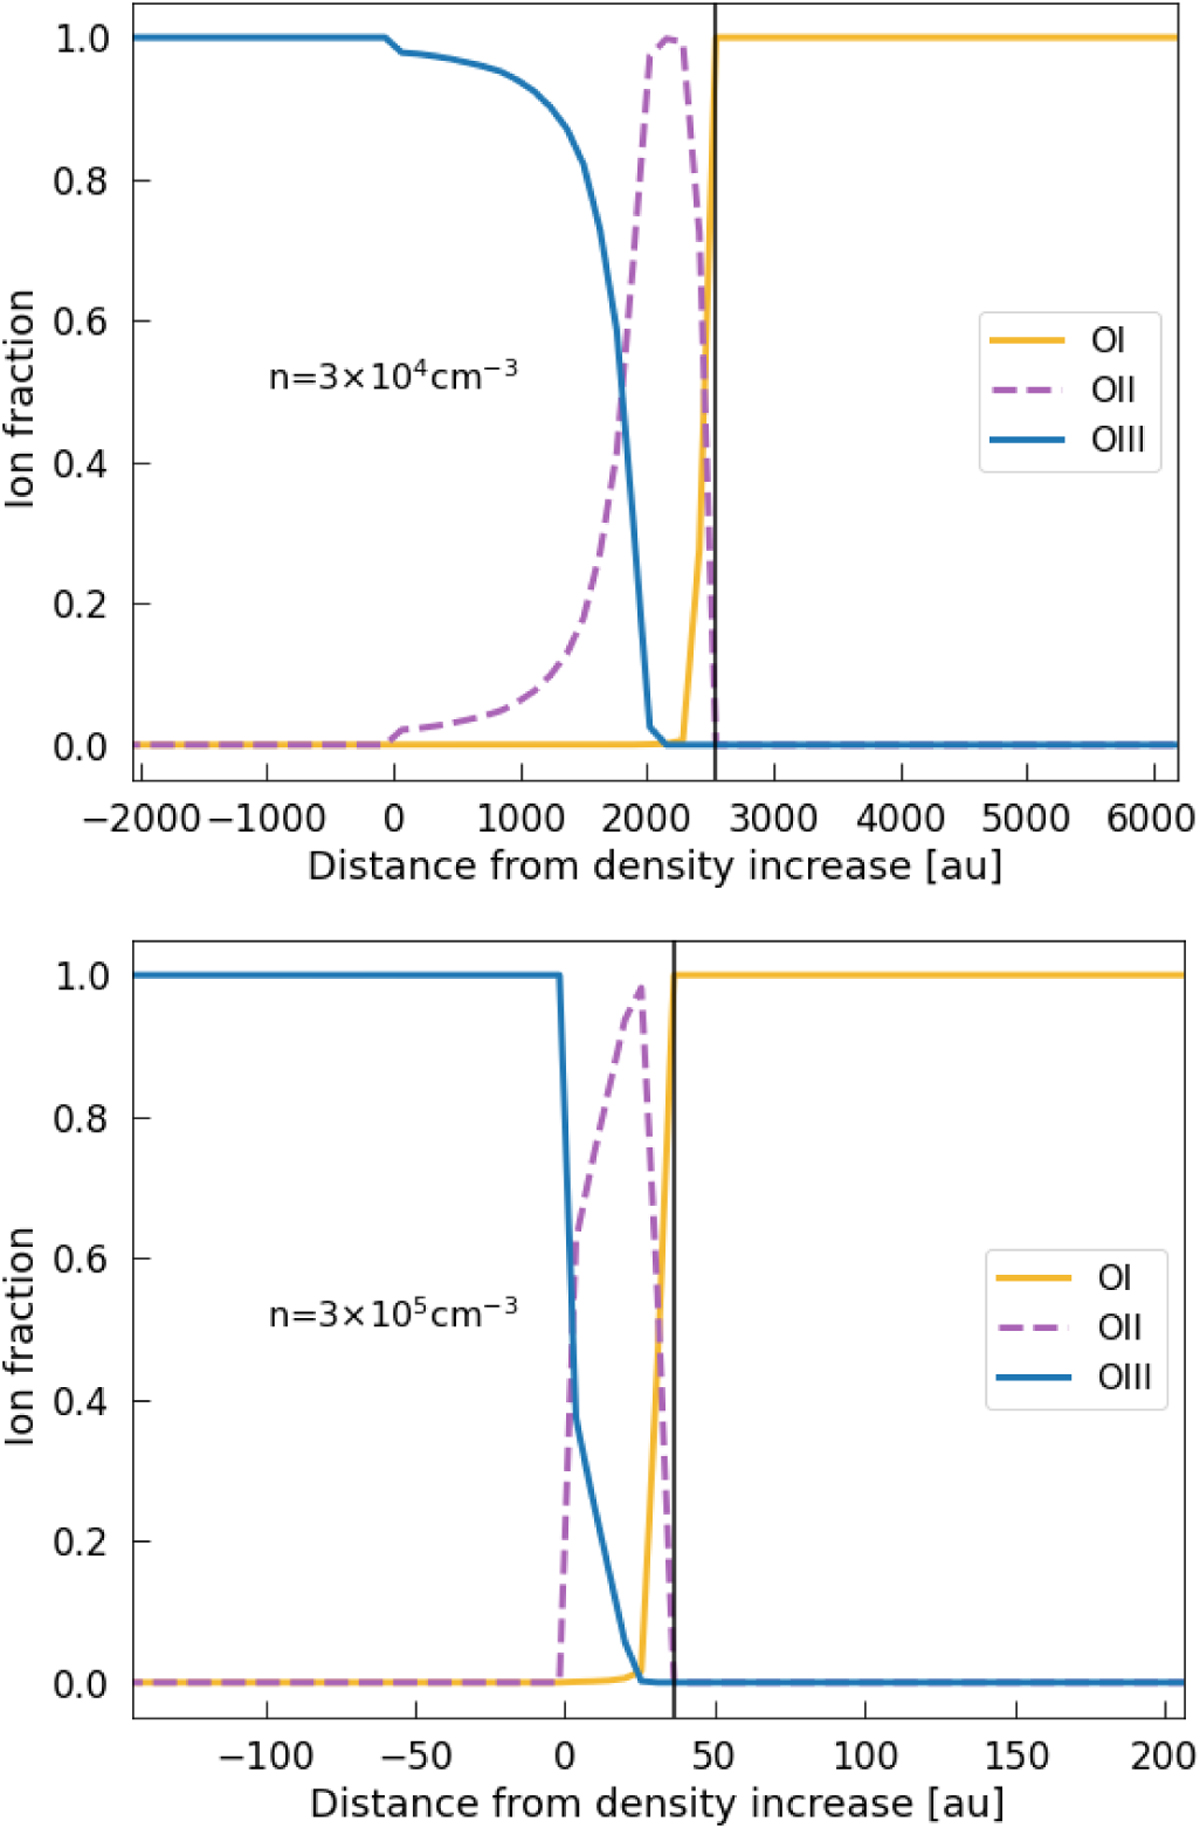
Example profiles of the oxygen ionization state as a function of distance from the density enhancement in the H II region (distance from the star of the proplyd cusp). The upper and lower panels are for densities of 3 × 104 cm−3 and 3 × 105 cm−3 respectively.
Current usage metrics show cumulative count of Article Views (full-text article views including HTML views, PDF and ePub downloads, according to the available data) and Abstracts Views on Vision4Press platform.
Data correspond to usage on the plateform after 2015. The current usage metrics is available 48-96 hours after online publication and is updated daily on week days.
Initial download of the metrics may take a while.