Fig. 3.
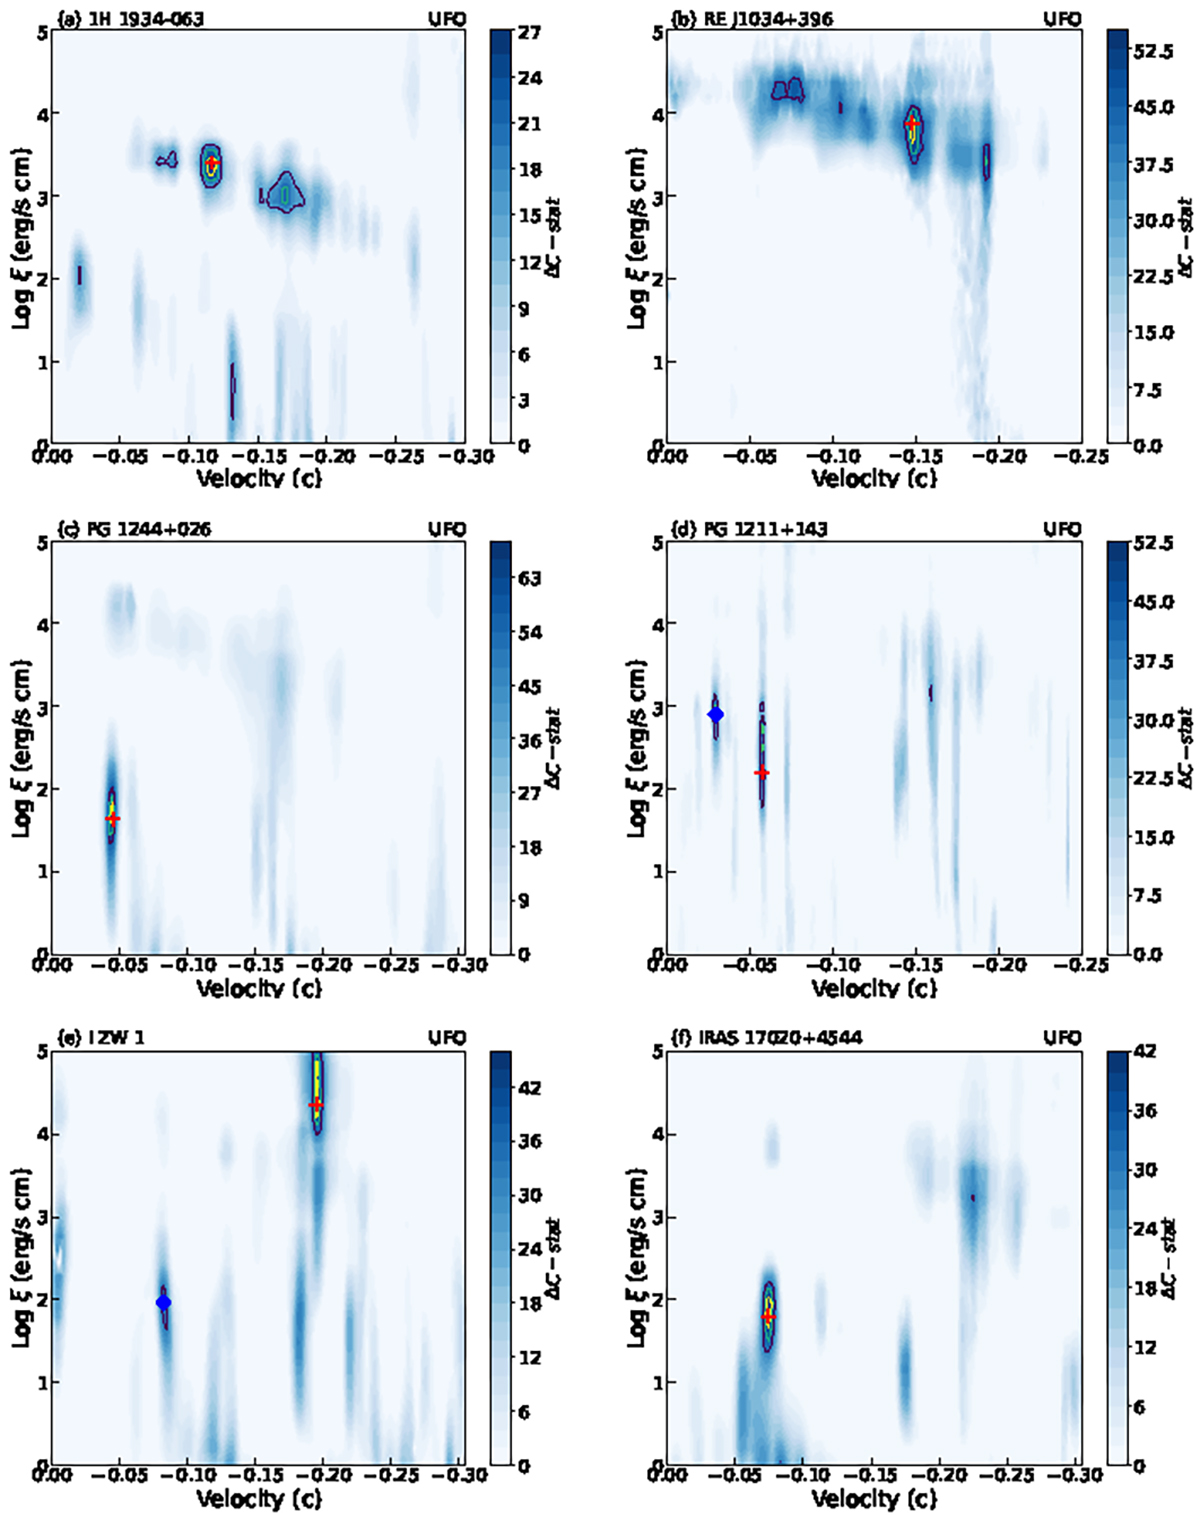
Download original image
Photoionization absorption model search for the time-averaged spectra of 1H 1934-063 (a), RE J1034+396 (b), PG 1244+026 (c), PG 1211+143 (d), I ZW 1 (e) and IRAS 17020+4544 (f) over the baseline model (continuum or plus WAs). The color illustrates the statistical improvement after adding an absorption component with a line width of 1500 km s−1 (except PG 1211+143 with σv = 500 km s−1). The purple, green, and yellow contour lines correspond to 99.73%, 95.4%, and 68.3% confidence level. The solution with the most significant detection is marked by a red cross and the secondary detection is marked by a blue diamond, while it may not be the final solution, as another potential solution can be the most significant detection during the spectral modeling when the line width σv is free to vary.
Current usage metrics show cumulative count of Article Views (full-text article views including HTML views, PDF and ePub downloads, according to the available data) and Abstracts Views on Vision4Press platform.
Data correspond to usage on the plateform after 2015. The current usage metrics is available 48-96 hours after online publication and is updated daily on week days.
Initial download of the metrics may take a while.