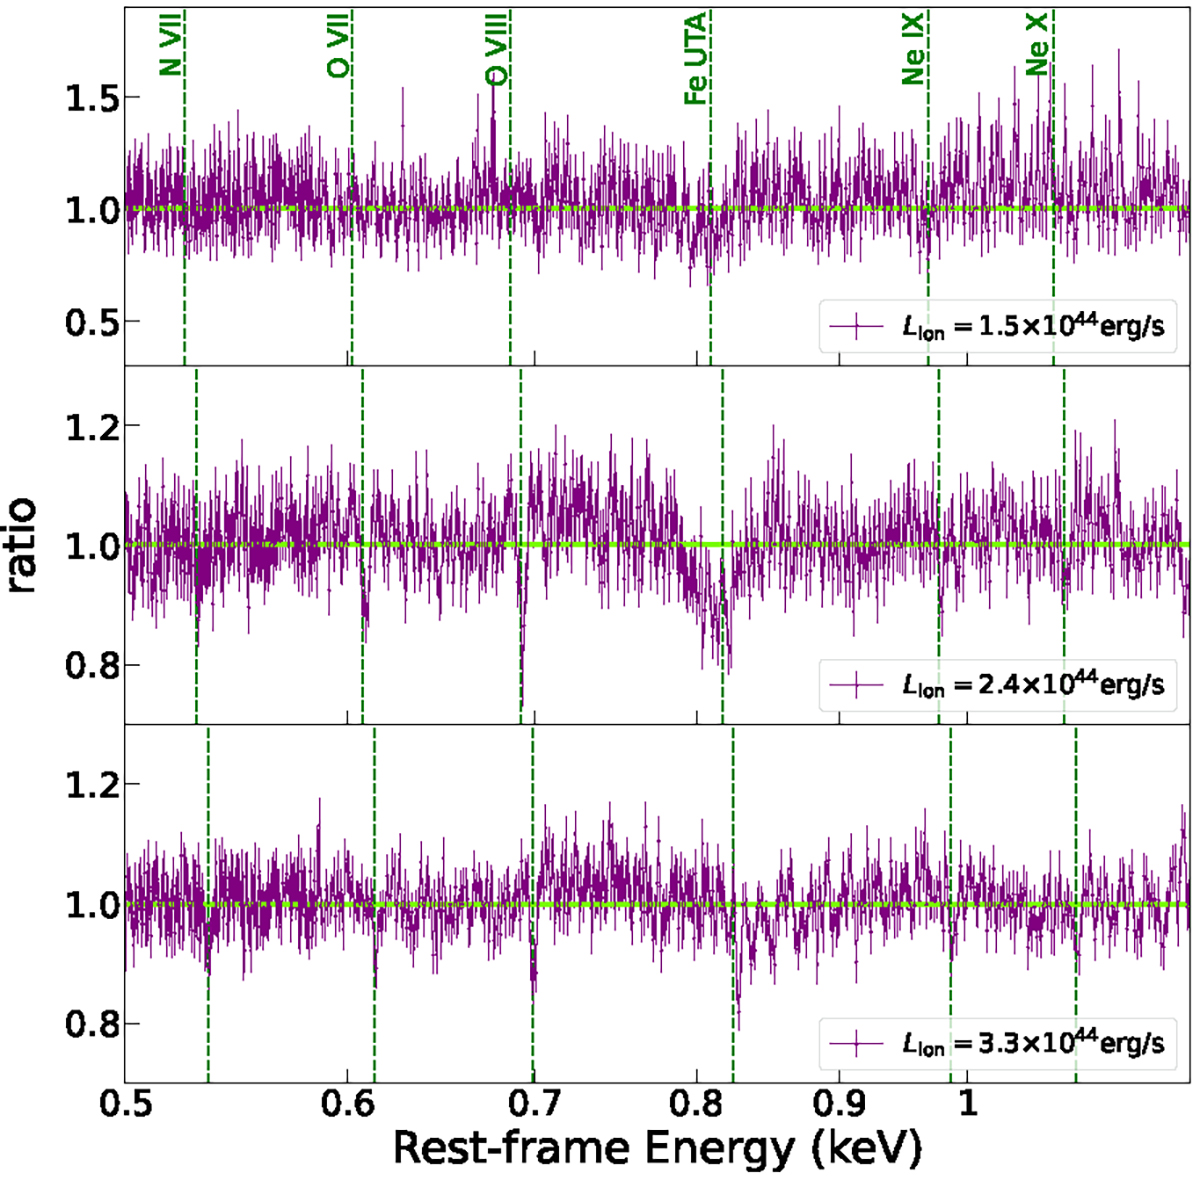
Fig. 10.
Download original image
Data/model ratio for the Athena/X-IFU spectra of PG 1211+143 at low (top), middle (middle), and high (bottom) states with an exposure time of 10 ks. The simulation of spectra is based on the best-fit continuum model, with the UFO ionization state predicted by the fit (see Table 3) and normalization adapted to reproduce the luminosity indicated in the legends. The UFO velocity is assumed to follow the trend of I ZW 1, instead of the constant trend of PG 1211+143, to simulate the change in UFO velocity. The vertical dashed green lines present the blueshifted UFO absorption features at different states.
Current usage metrics show cumulative count of Article Views (full-text article views including HTML views, PDF and ePub downloads, according to the available data) and Abstracts Views on Vision4Press platform.
Data correspond to usage on the plateform after 2015. The current usage metrics is available 48-96 hours after online publication and is updated daily on week days.
Initial download of the metrics may take a while.