Open Access
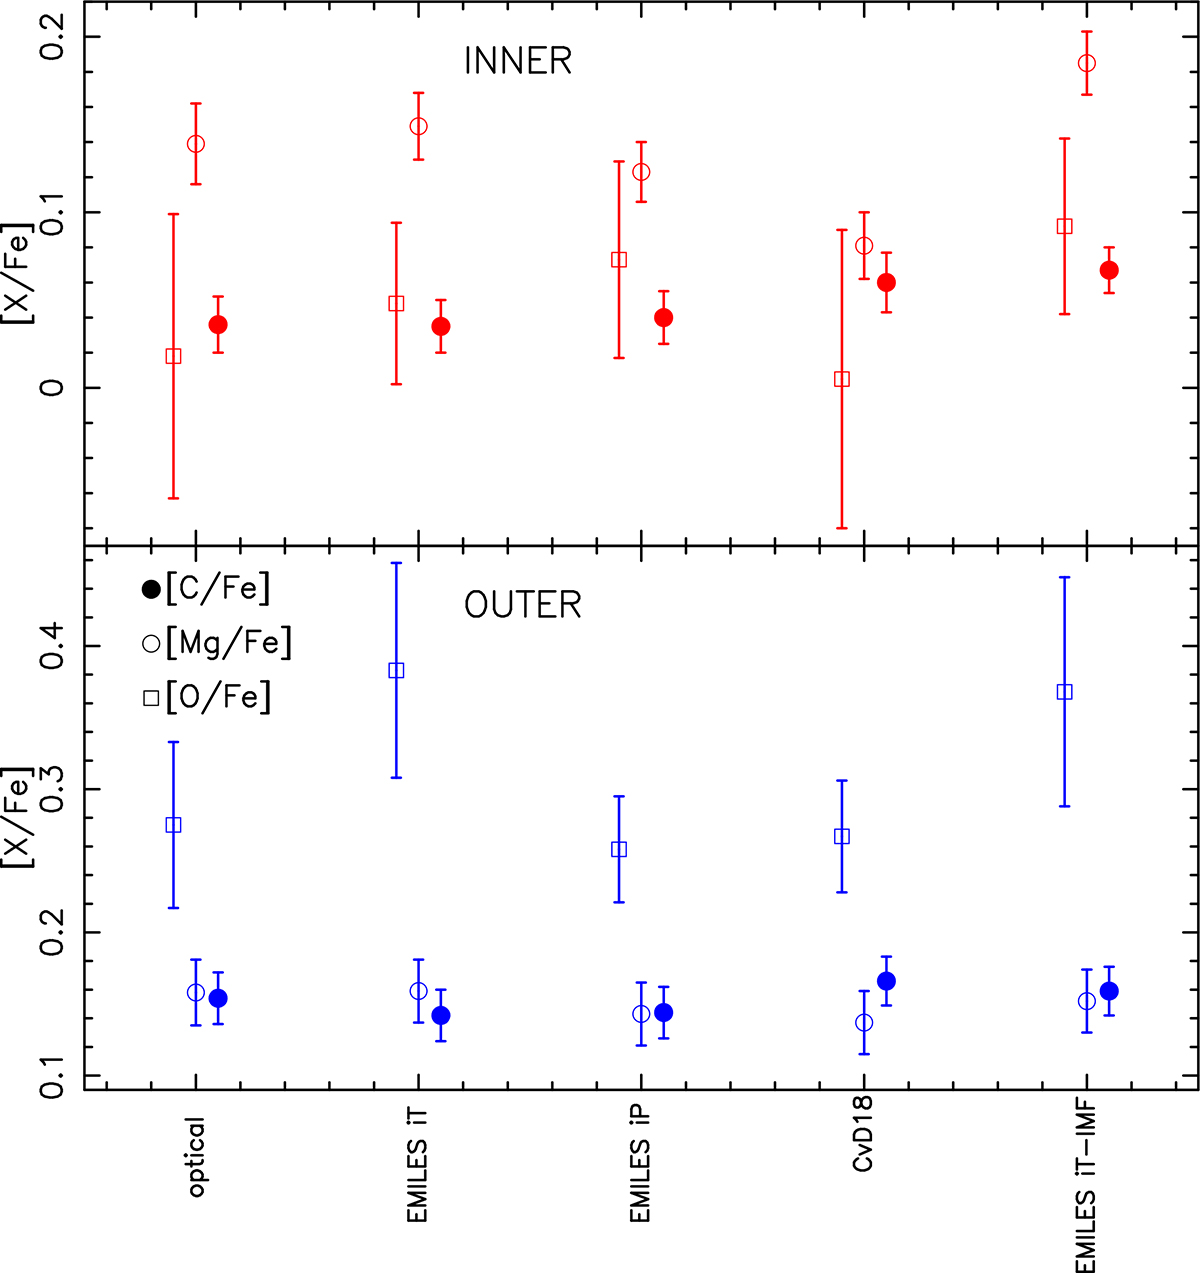
Fig. 6.
Download original image
[C/Fe], [Mg/Fe], and [O/Fe] abundance ratios (dots, empty circles, and squares, respectively) are shown for different methods and sets of indices (see the labels on the x-axis), and for the inner (top) and outer (bottom) radial bins of the M31 bulge. Error bars correspond to 1-sigma uncertainties.
Current usage metrics show cumulative count of Article Views (full-text article views including HTML views, PDF and ePub downloads, according to the available data) and Abstracts Views on Vision4Press platform.
Data correspond to usage on the plateform after 2015. The current usage metrics is available 48-96 hours after online publication and is updated daily on week days.
Initial download of the metrics may take a while.