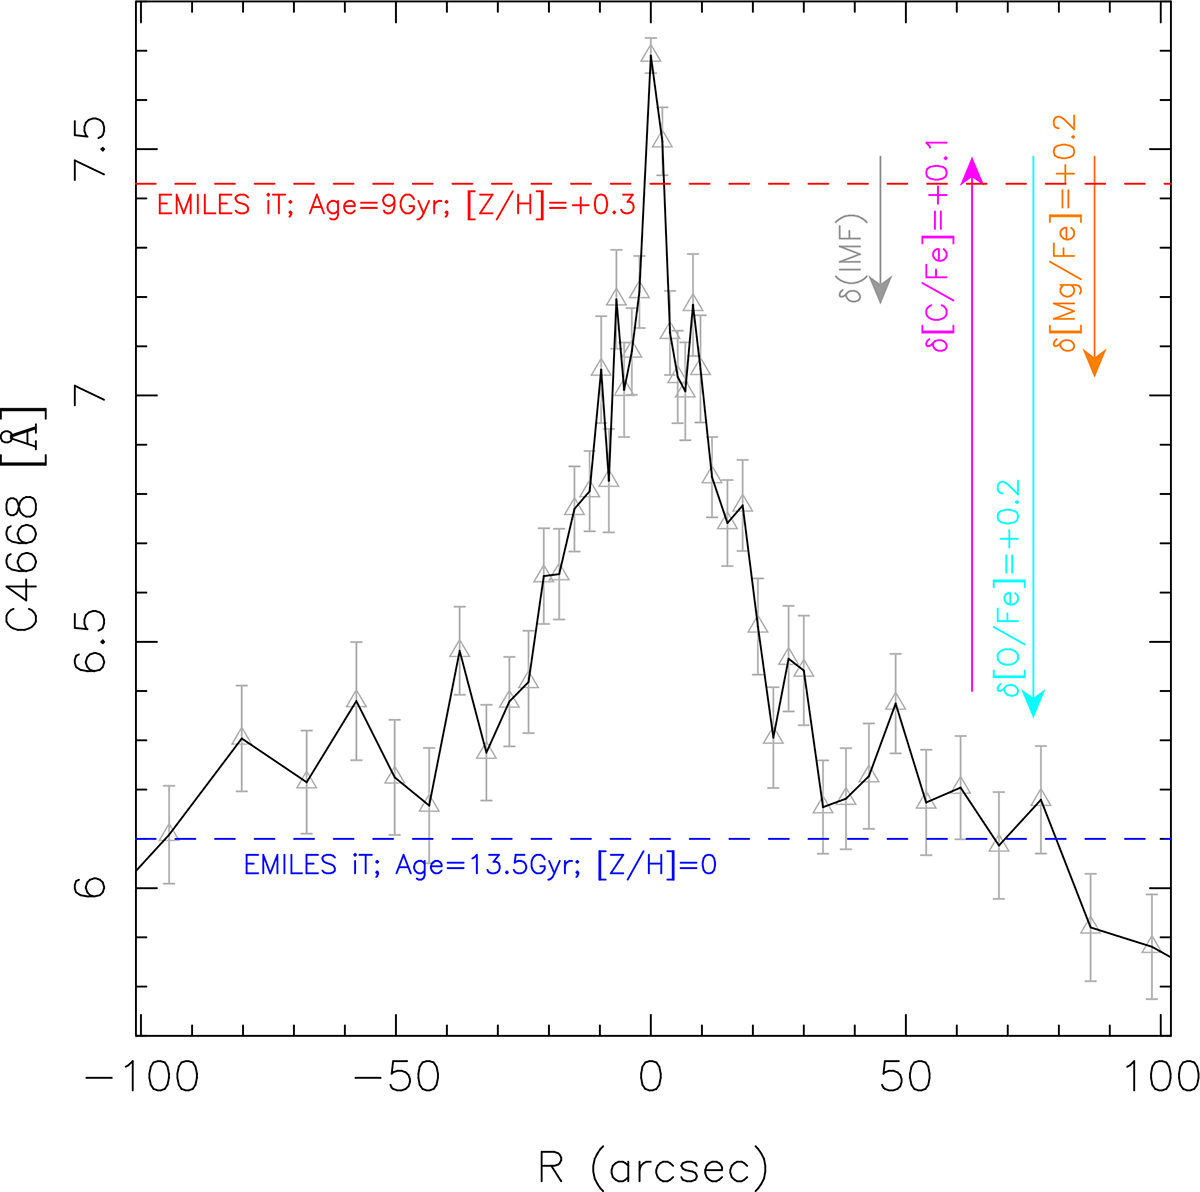
Fig. B.1.
Download original image
Radial profile of the C4668 spectral index, from the optical GTC spectroscopy of the M31 bulge (see the text). The profile is plotted over the same radial range as the CO indices (see Fig. 3). Error bars correspond to 1 sigma uncertainties on spectral indices. The horizontal dashed lines mark the predictions of 1SSP EMILES models, with Teramo isochrones, for the central and outer regions of the bulge (see Fig. 4), i.e. for an age of 9 Gyr and [Z/H]= + 0.3 (red), and for an age of 13.5 Gyr and [Z/H] = 0 (blue), respectively. The arrows are the same as those in Fig. 4), i.e. the pink, cyan and, orange arrows show the effect of varying [C/Fe], [O/Fe], and [Mg/Fe] abundance ratios, according to CvD18 models, while the gray arrow shows the effect of varying the IMF from Γb = 1.3 (Kroupa-like), to Γb = 2.5.
Current usage metrics show cumulative count of Article Views (full-text article views including HTML views, PDF and ePub downloads, according to the available data) and Abstracts Views on Vision4Press platform.
Data correspond to usage on the plateform after 2015. The current usage metrics is available 48-96 hours after online publication and is updated daily on week days.
Initial download of the metrics may take a while.