Fig. 2
Download original image
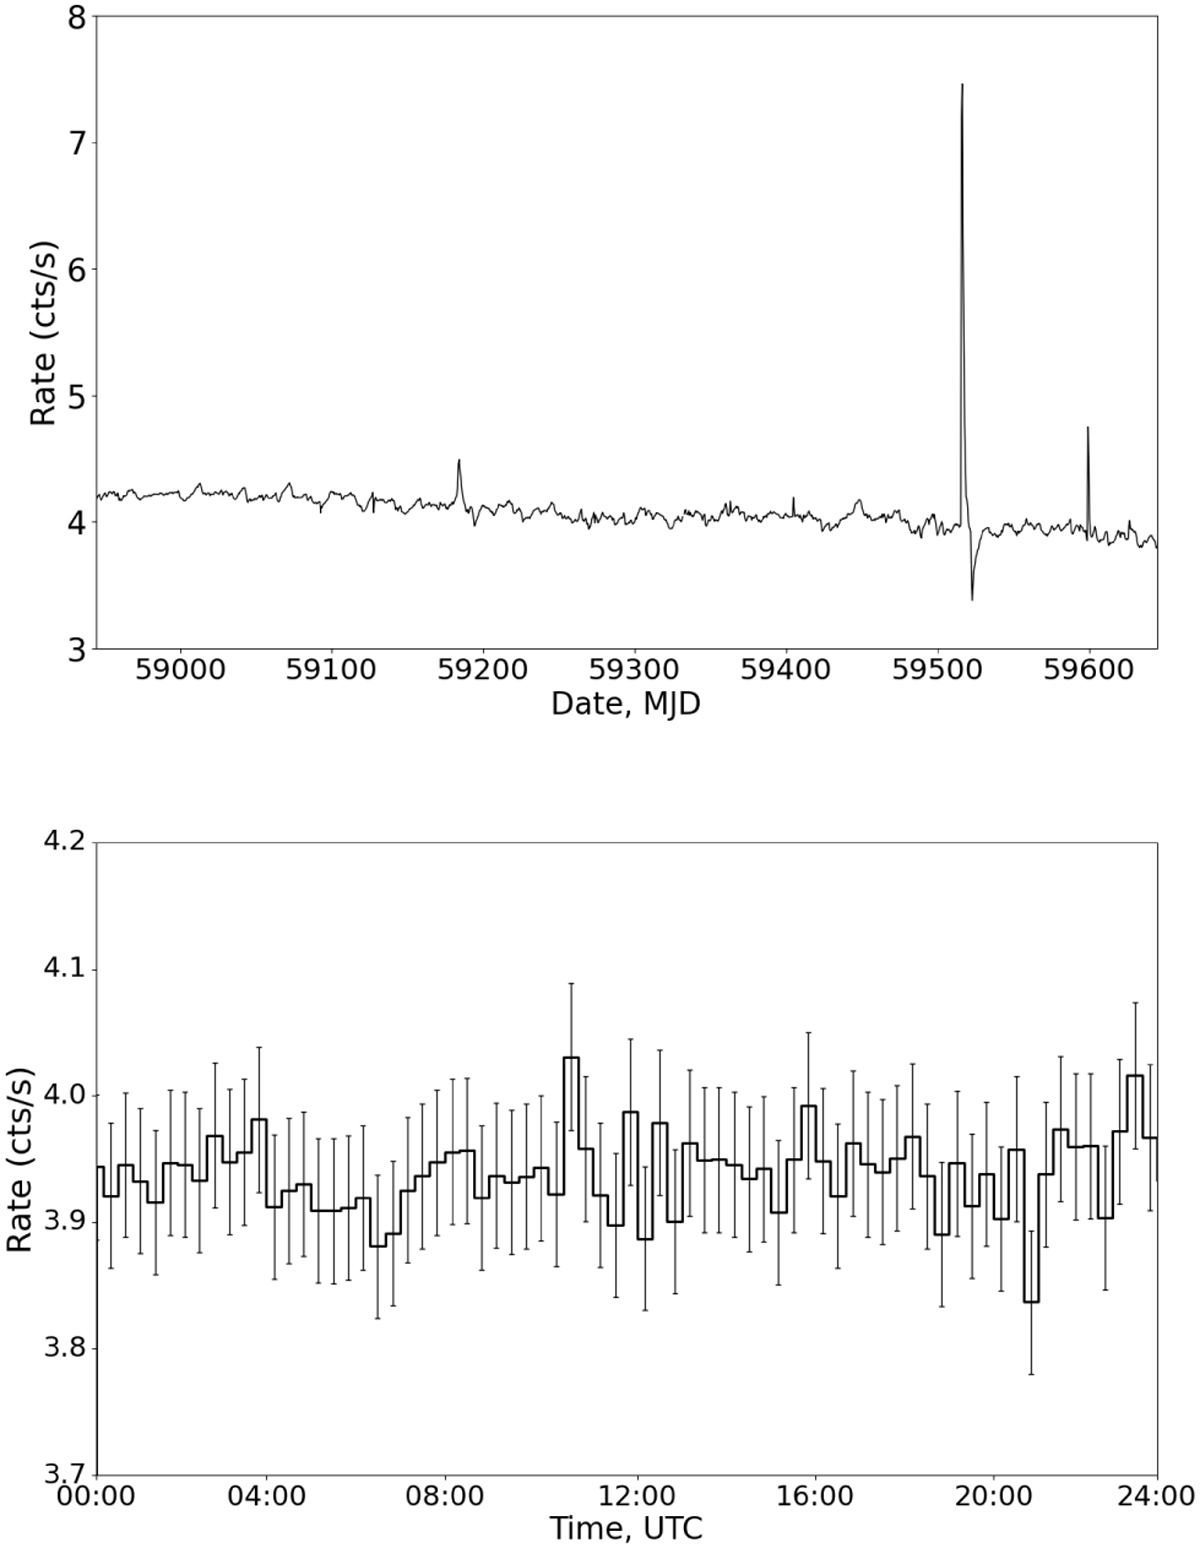
Particle background measured by one of the ART-XC detectors in the 60–120 keV energy band over the course of the SRG all-sky survey (top panel) and on an arbitrary day of the survey (bottom panel, with the error bars showing the corresponding Poisson uncertainties). The few sharp variations visible in the long-term light curve are due to solar flares, and such short periods are excised from the data analysis.
Current usage metrics show cumulative count of Article Views (full-text article views including HTML views, PDF and ePub downloads, according to the available data) and Abstracts Views on Vision4Press platform.
Data correspond to usage on the plateform after 2015. The current usage metrics is available 48-96 hours after online publication and is updated daily on week days.
Initial download of the metrics may take a while.