Fig. 5.
Download original image
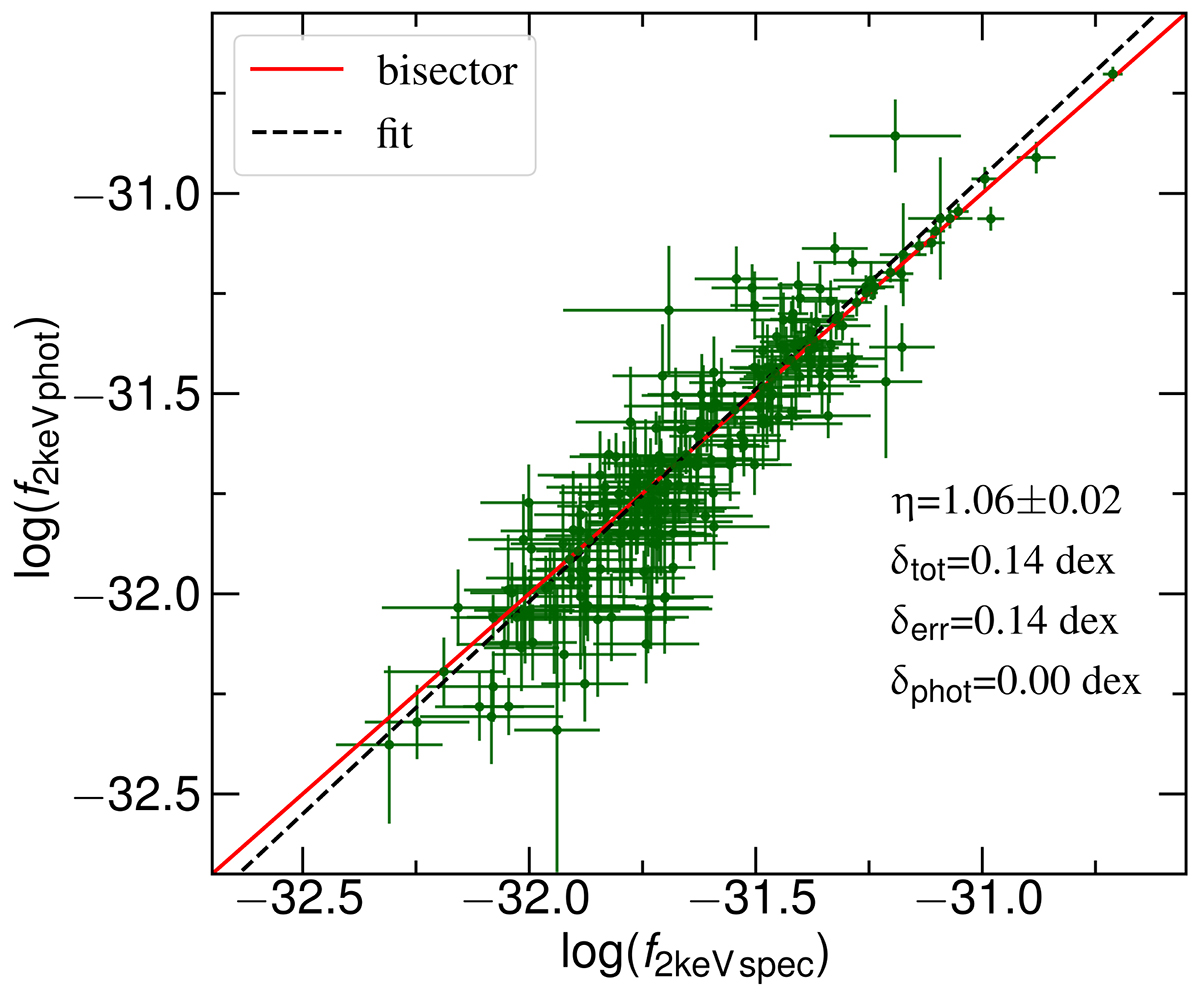
Comparison of the 2-keV monochromatic flux estimate derived from photometric data (see L20) and the one derived from spectroscopic data for the subsample of objects with only one observation in the 4XMM-DR9 catalogue. The solid red line represents the bisector, while the black dashed line is the best fit, with a slope of η = 1.06 ± 0.02. The total scatter around the best fit is equal to the average uncertainties, δerr = δtot = 0.14 dex. The intrinsic dispersion of the relation is therefore zero. Overall, we can say that there is no significant contribution to the observed dispersion that comes from using photometric X-ray data instead of spectroscopic data.
Current usage metrics show cumulative count of Article Views (full-text article views including HTML views, PDF and ePub downloads, according to the available data) and Abstracts Views on Vision4Press platform.
Data correspond to usage on the plateform after 2015. The current usage metrics is available 48-96 hours after online publication and is updated daily on week days.
Initial download of the metrics may take a while.