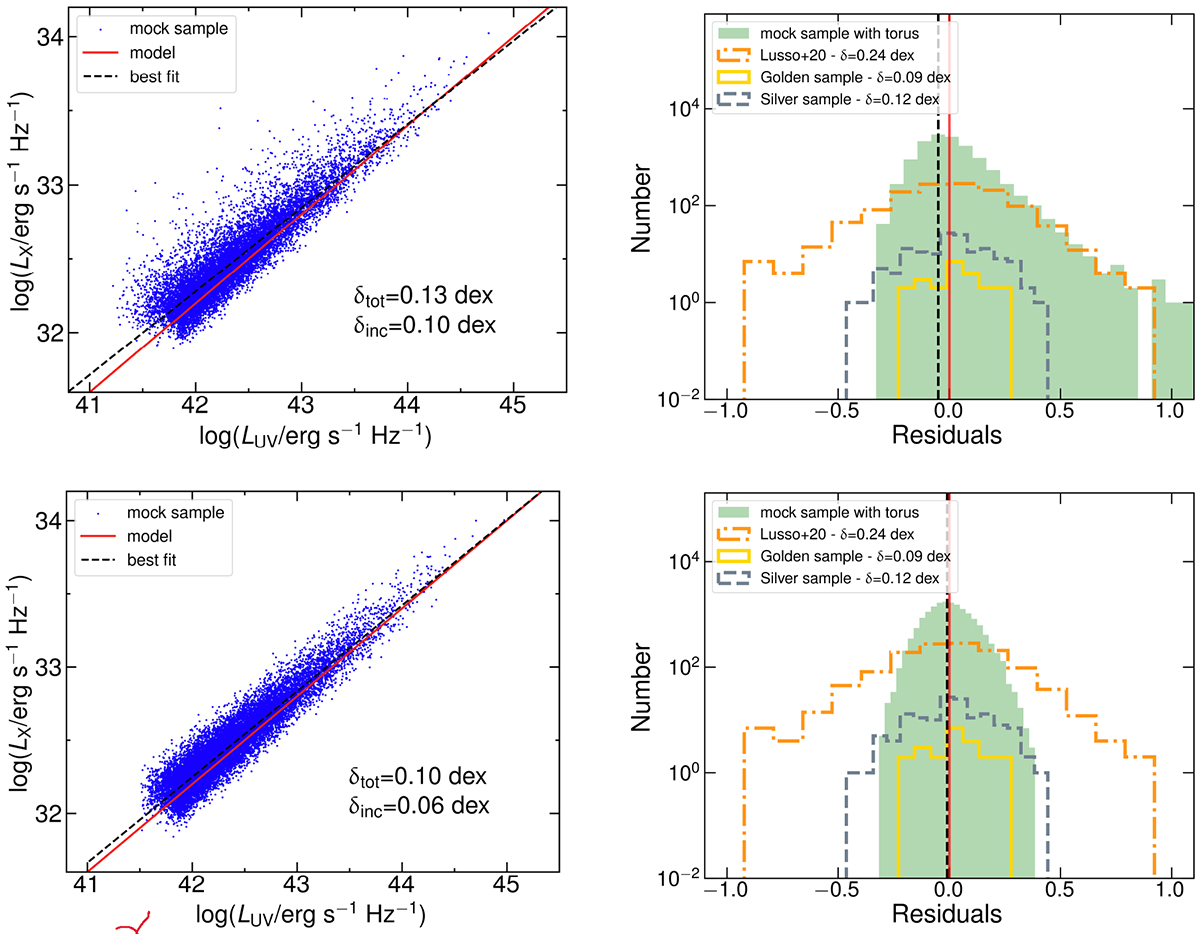
Fig. 4.
Download original image
LX − LUV relation and its spread for the two mock samples we considered, with and without the assumption of an obscuring torus. The residuals of the relation are also shown, in comparison with the results of the L20 and the Sacchi et al. (2022) samples. Upper left panel: mock sample of 100 000 quasars assuming an intrinsic relation with zero intrinsic dispersion, a contribution from variability to the observed dispersion of 0.08 dex, and an inclination angle between 0 and 90°. For each object, a redshift is assigned using the L20 sample redshift distribution; given the redshift, the corresponding luminosity function from Ross et al. (2013) is derived, and a luminosity is extracted. The red solid line is the starting sample, with a slope γ = 0.6 and a zero dispersion. The blue points show the sample after the dispersion due to variability is added and the objects are assigned a random inclination. The total dispersion of the sample is δtot = 0.13 dex, the inclination effect accounts for δinc = 0.10 dex. Upper right panel: histogram of the fit residuals, in filled green. This distribution is skewed, with a skewness parameter of s = 1.18. In dot-dashed orange, the histogram of the residuals for the L20 sample is shown for comparison. We see that the L20 distribution, which is the observed one, is instead much more symmetric, with a skewness parameter of sL20 = 0.20. The residuals corresponding to the “silver sample” and the “golden sample” of Sacchi et al. (2022) (details in Sect. 6) are plotted in dashed silver and in solid gold, respectively. The red solid vertical line corresponds to zero, while the dashed black vertical line corresponds to the peak of the mock sample distribution, equal to −0.05. All the histograms are shown in logarithmic units to enhance the readability. Lower left panel: same as the upper left panel, but assuming the presence of an obscurer with an angle width of ψtorus = 25°, which means that the inclination angle for the objects in the mock sample can go from 0 to 65°. The total dispersion is reduced to δtot = 0.10 dex, and the inclination effect accounts for δinc = 0.06 dex. Lower right panel: same as the upper right panel, but assuming the presence of an obscurer with an angle width of ψtorus = 25°. Here we see that the residuals distribution is symmetric, with a skewness parameter of s = 0.19 consistent with the L20 results.
Current usage metrics show cumulative count of Article Views (full-text article views including HTML views, PDF and ePub downloads, according to the available data) and Abstracts Views on Vision4Press platform.
Data correspond to usage on the plateform after 2015. The current usage metrics is available 48-96 hours after online publication and is updated daily on week days.
Initial download of the metrics may take a while.