Fig. 7
Download original image
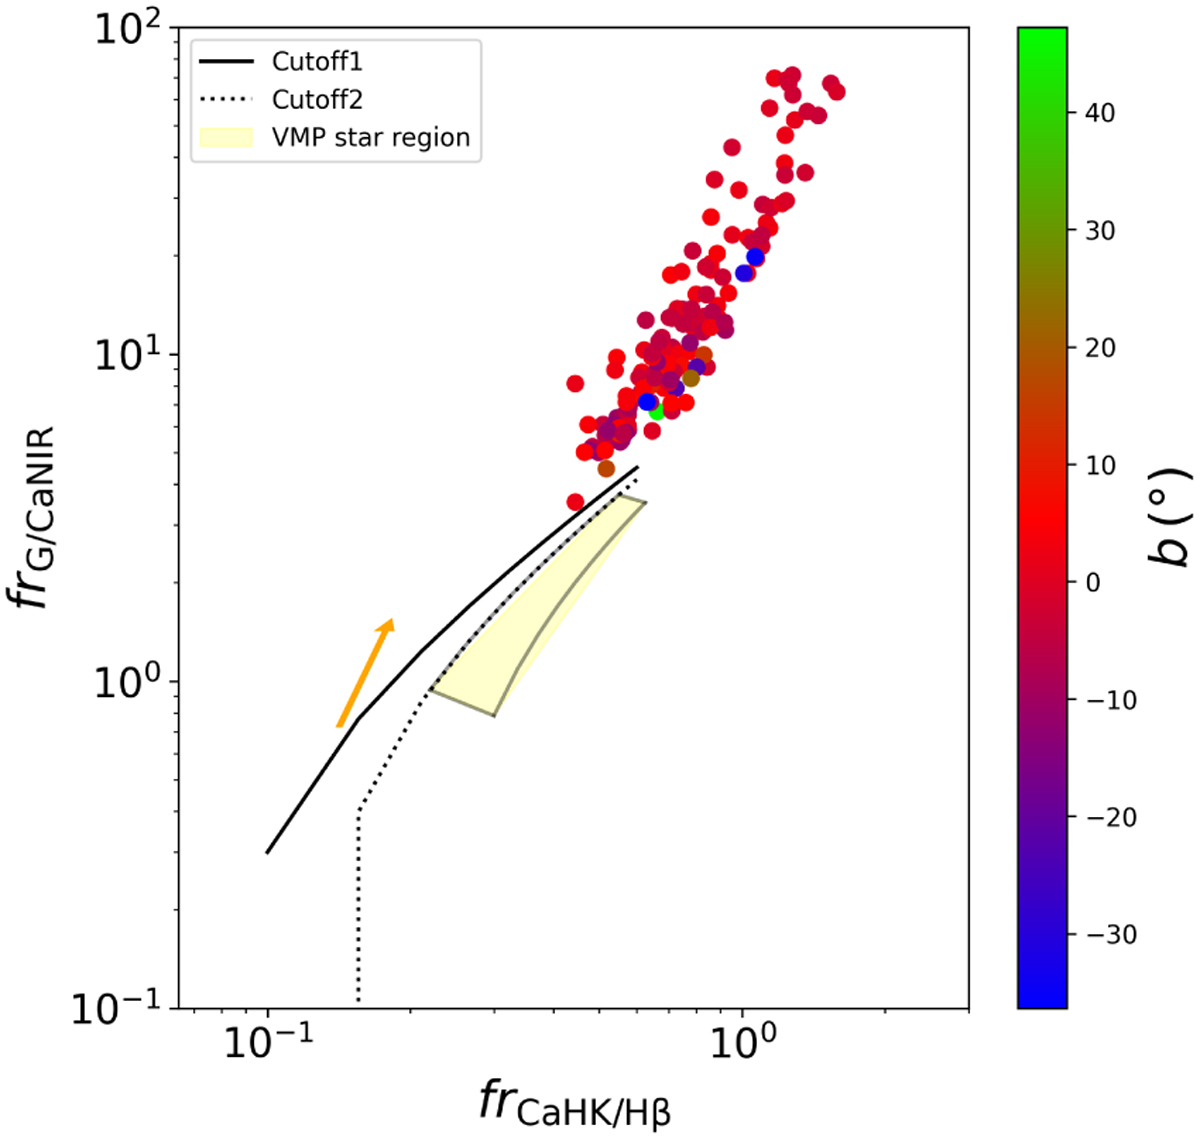
Flux ratios of OBA stars. The solid and dotted lines represent Cutoff1 and Cutoff2, respectively, while the yellow shaded area designates the region that is populated by very metal-poor stars (see Fig. 3). The color-coding indicates the Galactic Latitude b of each star. As can be seen, most of the stars are located on the Galactic plane (| b |≤ 10°). The orange arrow illustrates the effect of extinction for a color excess E(B − V) ≈ 0.3 mag. The nock and the point of the arrow represent the flux ratios before and after dereddening, respectively.
Current usage metrics show cumulative count of Article Views (full-text article views including HTML views, PDF and ePub downloads, according to the available data) and Abstracts Views on Vision4Press platform.
Data correspond to usage on the plateform after 2015. The current usage metrics is available 48-96 hours after online publication and is updated daily on week days.
Initial download of the metrics may take a while.