Fig. 6
Download original image
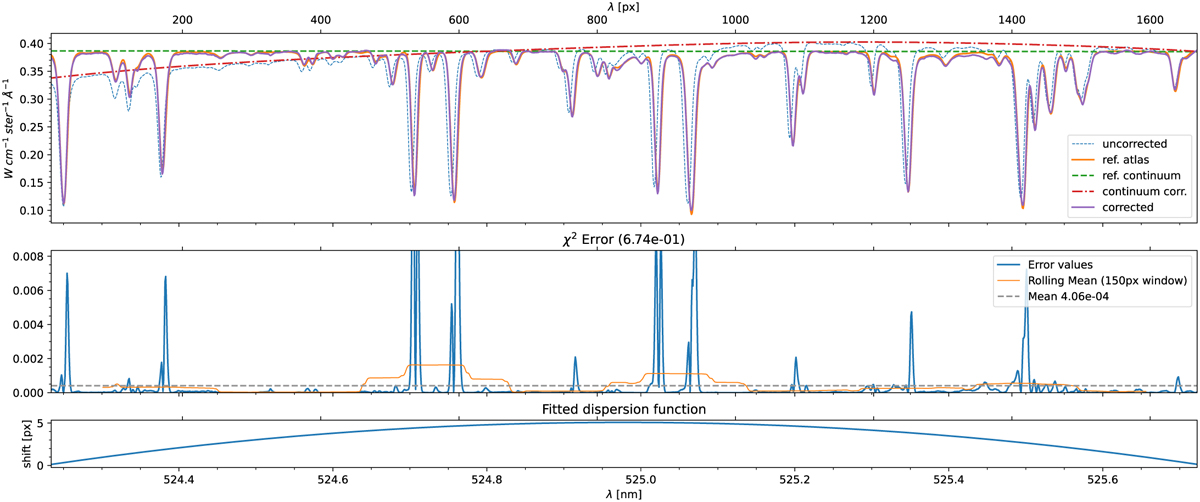
Spectral and continuum calibration using the FTS quiet-Sun, disk-center atlas from Neckel (1999). The top panel shows the uncorrected and corrected spectrum, the used continuum correction curve, the atlas reference continuum level and the atlas (see legend). The middel panel presents the difference between the atlas and the calibrated data in units of the above panel. The lowest panel shows the fitted dispersion offset in pixels.
Current usage metrics show cumulative count of Article Views (full-text article views including HTML views, PDF and ePub downloads, according to the available data) and Abstracts Views on Vision4Press platform.
Data correspond to usage on the plateform after 2015. The current usage metrics is available 48-96 hours after online publication and is updated daily on week days.
Initial download of the metrics may take a while.