Fig. 2
Download original image
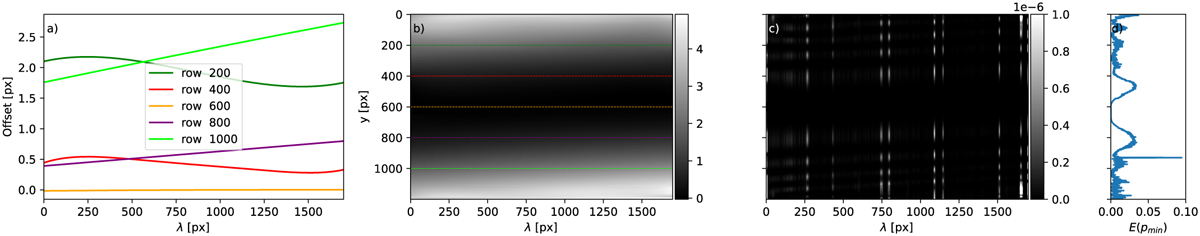
Offset map profiles shown in panel a for the colored rows indicated in panel b. Map of detected offsets in panel b. Color indicates the amount of shifting needed in units of pixels for each pixel along the x-axis to remove the smile distortion. Panel c shows a map of the pixel-wise error 𝓔(pmin, x), and panel d the result of the error function as of Eq. (1) for the selected polynomials.
Current usage metrics show cumulative count of Article Views (full-text article views including HTML views, PDF and ePub downloads, according to the available data) and Abstracts Views on Vision4Press platform.
Data correspond to usage on the plateform after 2015. The current usage metrics is available 48-96 hours after online publication and is updated daily on week days.
Initial download of the metrics may take a while.