Open Access
Fig. 14
Download original image
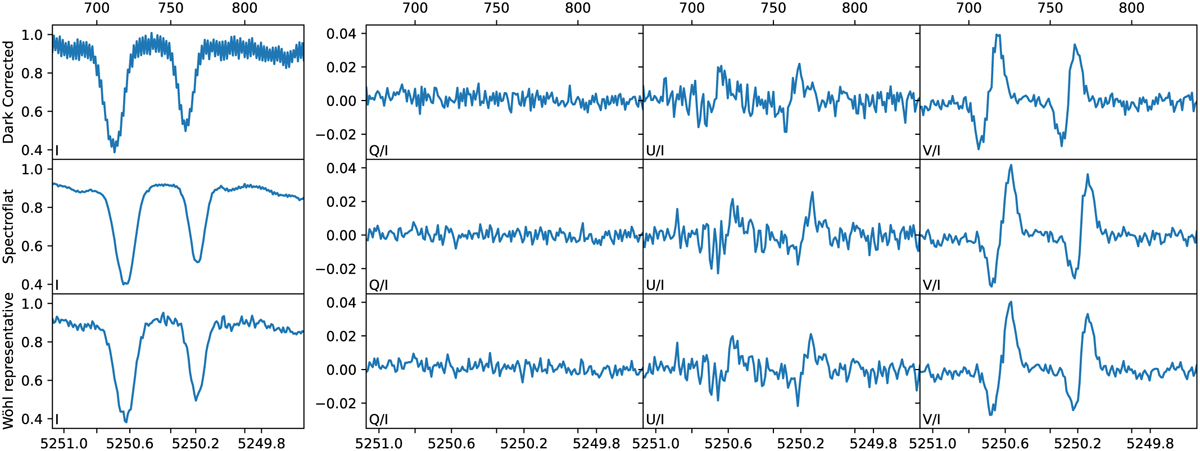
Spectral profiles at row number 150 of the images shown in Fig. 13. Top and bottom x-axis scales indicate the pixel position and the wavelength in A, respectively. Note: the spectrum is flipped in wavelength direction with respect to the standard convention.
Current usage metrics show cumulative count of Article Views (full-text article views including HTML views, PDF and ePub downloads, according to the available data) and Abstracts Views on Vision4Press platform.
Data correspond to usage on the plateform after 2015. The current usage metrics is available 48-96 hours after online publication and is updated daily on week days.
Initial download of the metrics may take a while.