Open Access
Fig. 12
Download original image
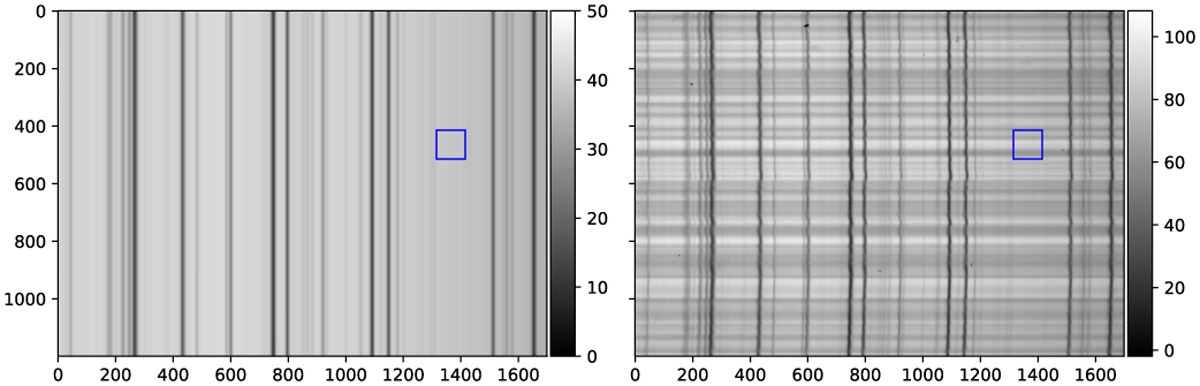
Position of the box to compute the RMS variation (Table 3) in one of the flat-field state images (left panel) and Stokes I of a science frames (right panel). Color bars give relative intensity in ADUs. The box is chosen such that spectral lines and strong dust impurities are avoided.
Current usage metrics show cumulative count of Article Views (full-text article views including HTML views, PDF and ePub downloads, according to the available data) and Abstracts Views on Vision4Press platform.
Data correspond to usage on the plateform after 2015. The current usage metrics is available 48-96 hours after online publication and is updated daily on week days.
Initial download of the metrics may take a while.