Fig. 9.
Download original image
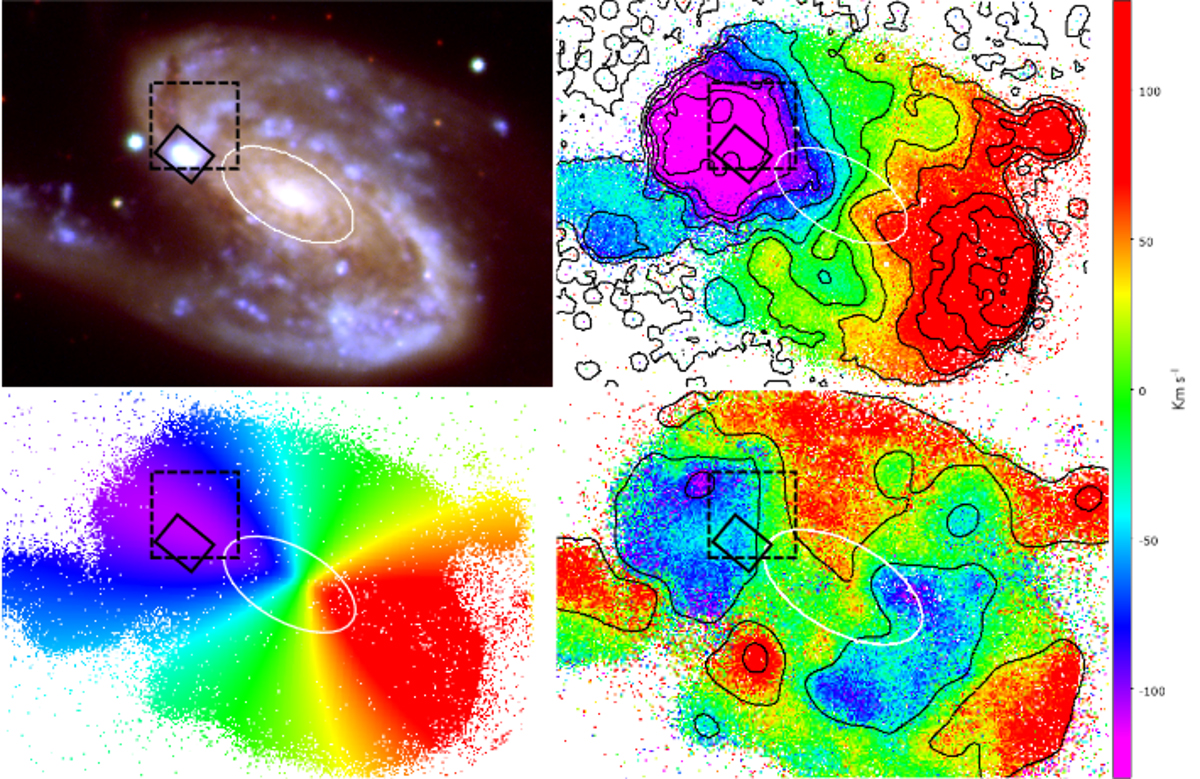
Different maps of NGC 6845. Top left: false-color optical Gemini image. The white ellipse represents the region that follows circular motions in the velocity field (top right panel). Top right: Hα velocity field. Bottom left: modeled velocity field. Bottom right: residual velocity field, derived from the observed and modeled velocity field. The bar scale represents the velocities in km s−1 of the residual map. The black box corresponds to the IFU/GMOS FoV, and the dashed black box corresponds to the area shown in Fig. 10.
Current usage metrics show cumulative count of Article Views (full-text article views including HTML views, PDF and ePub downloads, according to the available data) and Abstracts Views on Vision4Press platform.
Data correspond to usage on the plateform after 2015. The current usage metrics is available 48-96 hours after online publication and is updated daily on week days.
Initial download of the metrics may take a while.