Fig. 8.
Download original image
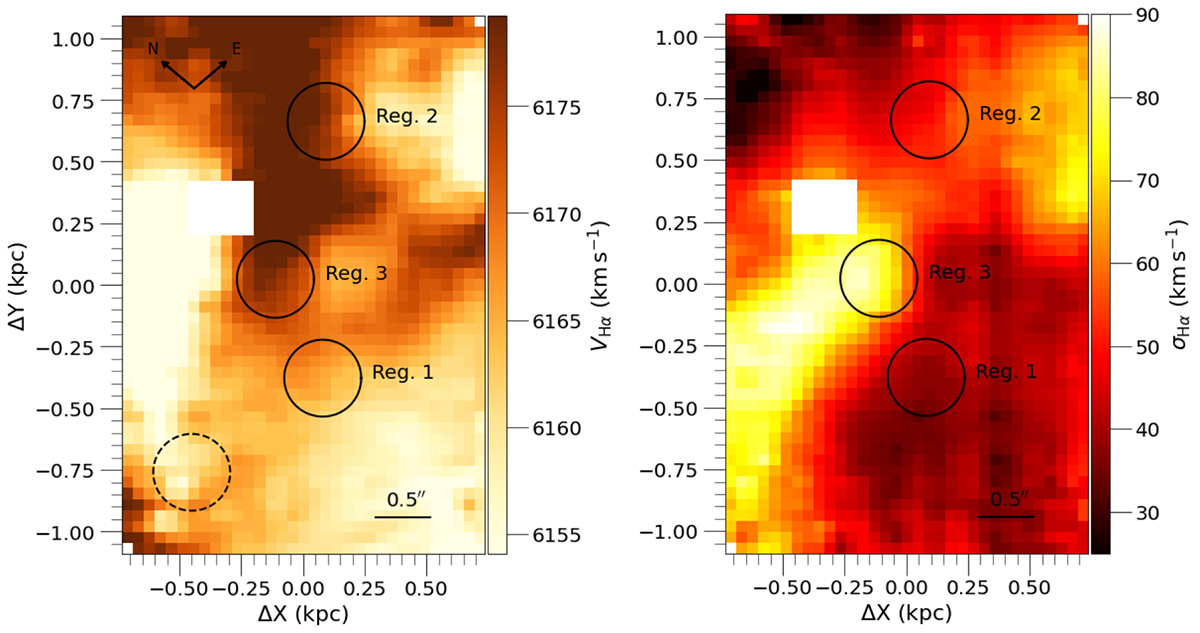
Velocity maps of region ID26. Left panel: velocity field near the hinge clump. This map was derived from a single Gaussian fit on the Hα emission line observed with Gemini/GMOS. Right panel: Hα velocity dispersion map of the same region as shown in the left panel. The top two panels show a white square that corresponds to a poor fiber in the IFU/GMOS.
Current usage metrics show cumulative count of Article Views (full-text article views including HTML views, PDF and ePub downloads, according to the available data) and Abstracts Views on Vision4Press platform.
Data correspond to usage on the plateform after 2015. The current usage metrics is available 48-96 hours after online publication and is updated daily on week days.
Initial download of the metrics may take a while.