Fig. 7.
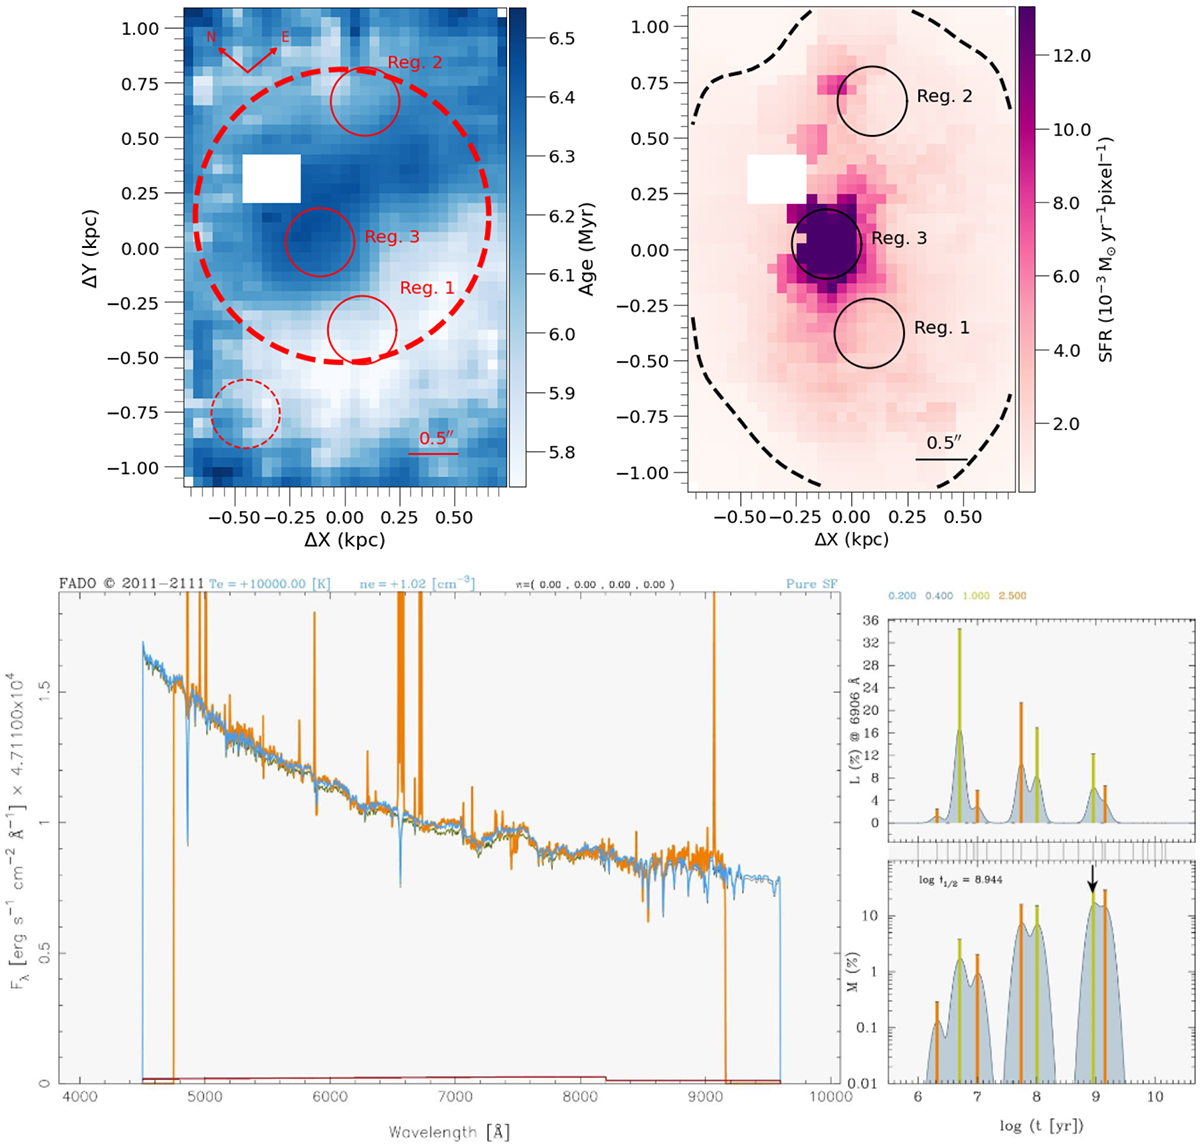
Download original image
Top left panel: Ages derived from the Hα equivalent width. The bold dashed red circle displays the ring-like structure encompassing the central clump of region ID26. The dashed circle in the bottom right corner represents the seeing area, and the bar in the bottom left corner is the angular scale. Top right panel: star formation rates, based on Hα luminosities. The isophote intensity, shown as the dashed black contour, is a hundredth of the peak of the Hα map, and delimits region ID26. The top panels show a white square that corresponds to a poor fiber in the IFU/GMOS. Bottom left panel: Standard FADO output of the MUSE-integrated spectra of region ID26 (orange line). In the same spectrum, we plot the best-fitting synthetic SED derived by FADO (light blue line), which is composed of stellar and nebular continuum emission (dark gray and red lines, respectively). In the upper part of that panel, we plot the electronic temperature (Te), electronic density (ne), and the probability (π) of the spectrum to fall in the locus of star-forming, composite, LINER, and Seyfert galaxies in the BPT diagram. Upper bottom right panel: FADO output plot showing luminosity fractions. The numbers in different colors correspond to different metallicities, and the vertical bars are ±1σ. Lower bottom right panel: Stellar mass fraction of the synthetic stellar populations. The thin gray lines connecting both diagrams correspond to the ages of the synthetic stellar populations.
Current usage metrics show cumulative count of Article Views (full-text article views including HTML views, PDF and ePub downloads, according to the available data) and Abstracts Views on Vision4Press platform.
Data correspond to usage on the plateform after 2015. The current usage metrics is available 48-96 hours after online publication and is updated daily on week days.
Initial download of the metrics may take a while.