Fig. 5.
Download original image
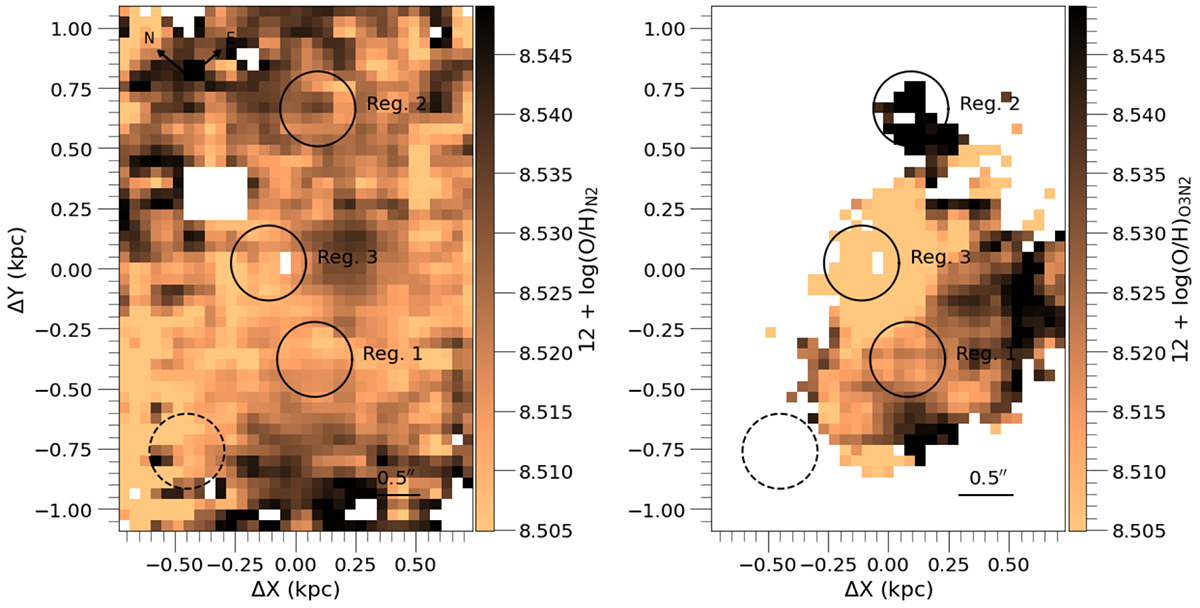
Metallicty maps of region ID26. Left panel: oxygen abundance map estimated from the N2 index (Storchi-Bergmann et al. 1994). Right panel: oxygen abundance map estimated from the O3N2 index (Alloin et al. 1979). The dashed circle in the bottom right corner represents the seeing, and the bar at left-bottom corner is the angular scale. All panels show a white square that corresponds to a poor fiber in the IFU/GMOS.
Current usage metrics show cumulative count of Article Views (full-text article views including HTML views, PDF and ePub downloads, according to the available data) and Abstracts Views on Vision4Press platform.
Data correspond to usage on the plateform after 2015. The current usage metrics is available 48-96 hours after online publication and is updated daily on week days.
Initial download of the metrics may take a while.