Fig. 4.
Download original image
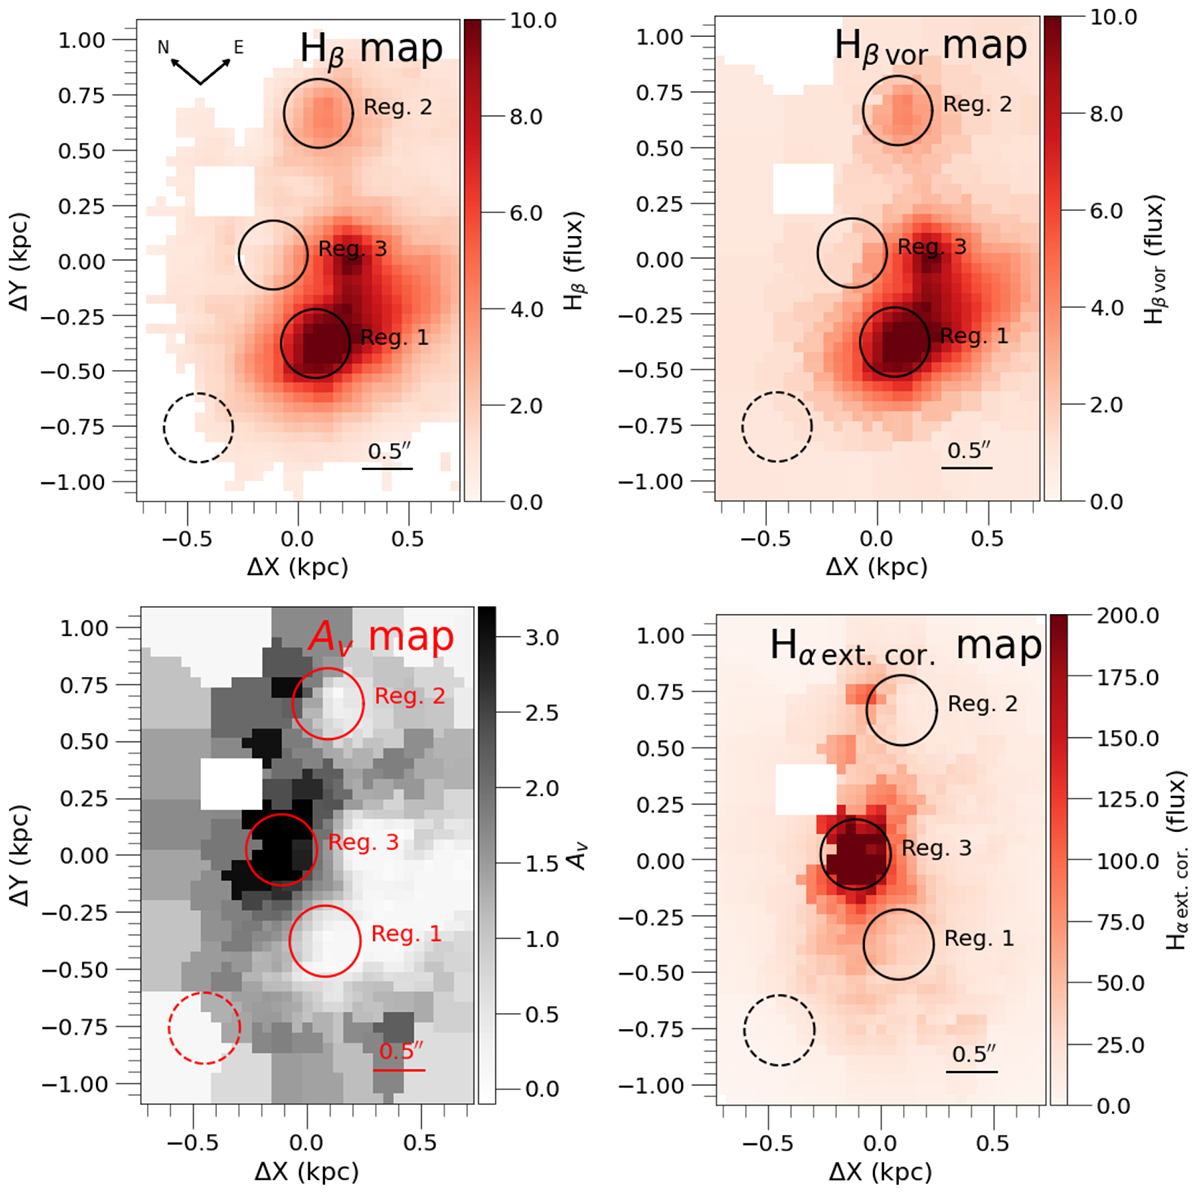
Hβ and extinction maps of region ID26. Top left panel: Hβ map. Top right panel: Hβ tessellation map. Bottom left panel: extinction map in magnitude. Bottom right panel: Hα extinction-corrected map. The flux maps are in ×10−17 erg s−1 cm−2 Å−1 pixel−1 units. The intensities in the maps are show in different ranges to highlight the substructure in region ID26. The dashed circles in the bottom right corners represent the seeing. The black bar in each panel shows the angular scale. All panels show a white square that masks a set of poor fibers in the IFU/GMOS.
Current usage metrics show cumulative count of Article Views (full-text article views including HTML views, PDF and ePub downloads, according to the available data) and Abstracts Views on Vision4Press platform.
Data correspond to usage on the plateform after 2015. The current usage metrics is available 48-96 hours after online publication and is updated daily on week days.
Initial download of the metrics may take a while.