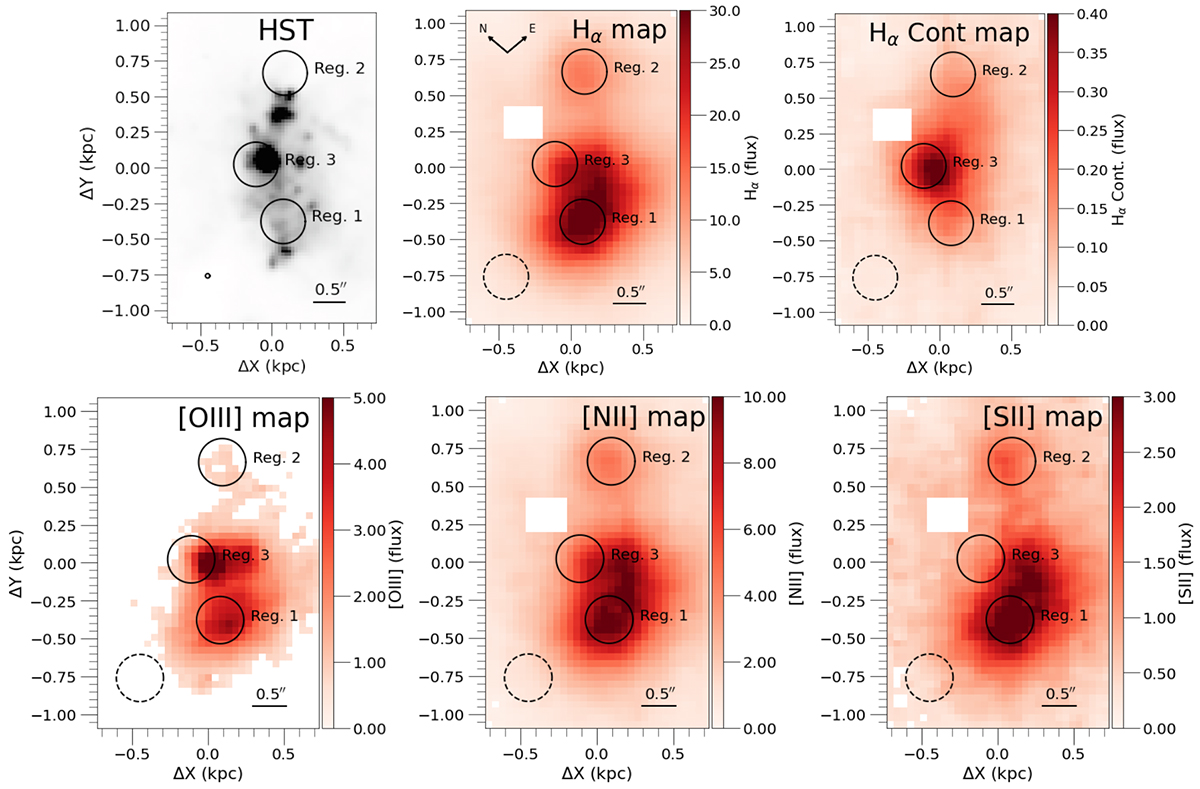
Fig. 3.
Download original image
Flux maps of region ID26. The top panels from left to right show the HST Hα map and the integrated continuum flux around the Hα line maps. The bottom panels show from left to right the [OIII] λ5007, [N II] λ6583, and [SII] λ6731 maps. The flux maps are in ×10−17 erg s−1 cm−2 Å−1 pixel−1 units. The intensities in the maps are shown in different ranges to highlight the substructures in region ID26. The dashed circle in the bottom right corner represents the seeing. The horizontal bar represents the angular scale. All IFU/GMOS panels show a white square that corresponds to poor fibers in the IFU/GMOS.
Current usage metrics show cumulative count of Article Views (full-text article views including HTML views, PDF and ePub downloads, according to the available data) and Abstracts Views on Vision4Press platform.
Data correspond to usage on the plateform after 2015. The current usage metrics is available 48-96 hours after online publication and is updated daily on week days.
Initial download of the metrics may take a while.