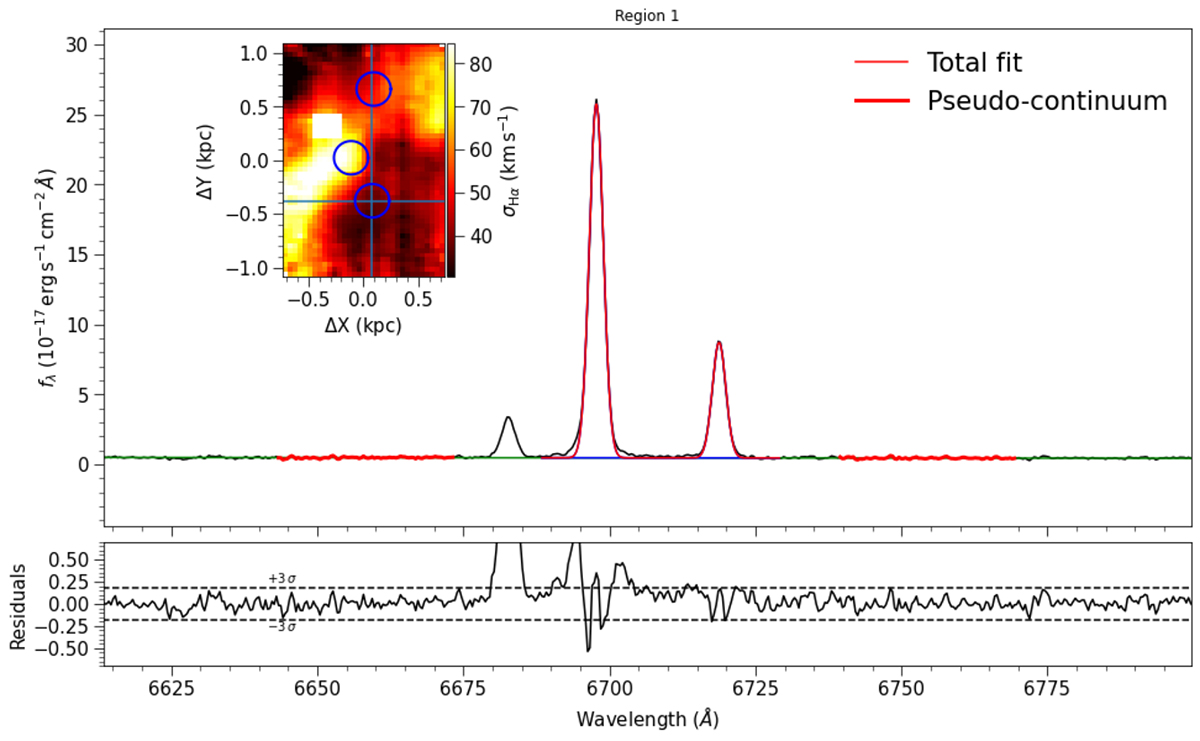
Fig. 2.
Download original image
Example of an Hα line profile for the central spaxel of region 1. The main panel shows the observed spectrum (black lines) within the Hα window. The red line shows the fitted Gaussian profiles for the Hα and [N II] λ 6583 lines, and the bold red intervals are the continuum windows we used to fit the continuum. The bottom panel shows the residual of the fit. The inset show the σHα map (in a large scale in the top right panel of Fig. 8). The blue courser indicates the single spaxel where the spectrum was taken. The blue circles label the regions we analyzed (see details in the text).
Current usage metrics show cumulative count of Article Views (full-text article views including HTML views, PDF and ePub downloads, according to the available data) and Abstracts Views on Vision4Press platform.
Data correspond to usage on the plateform after 2015. The current usage metrics is available 48-96 hours after online publication and is updated daily on week days.
Initial download of the metrics may take a while.