Open Access
Fig. 11.
Download original image
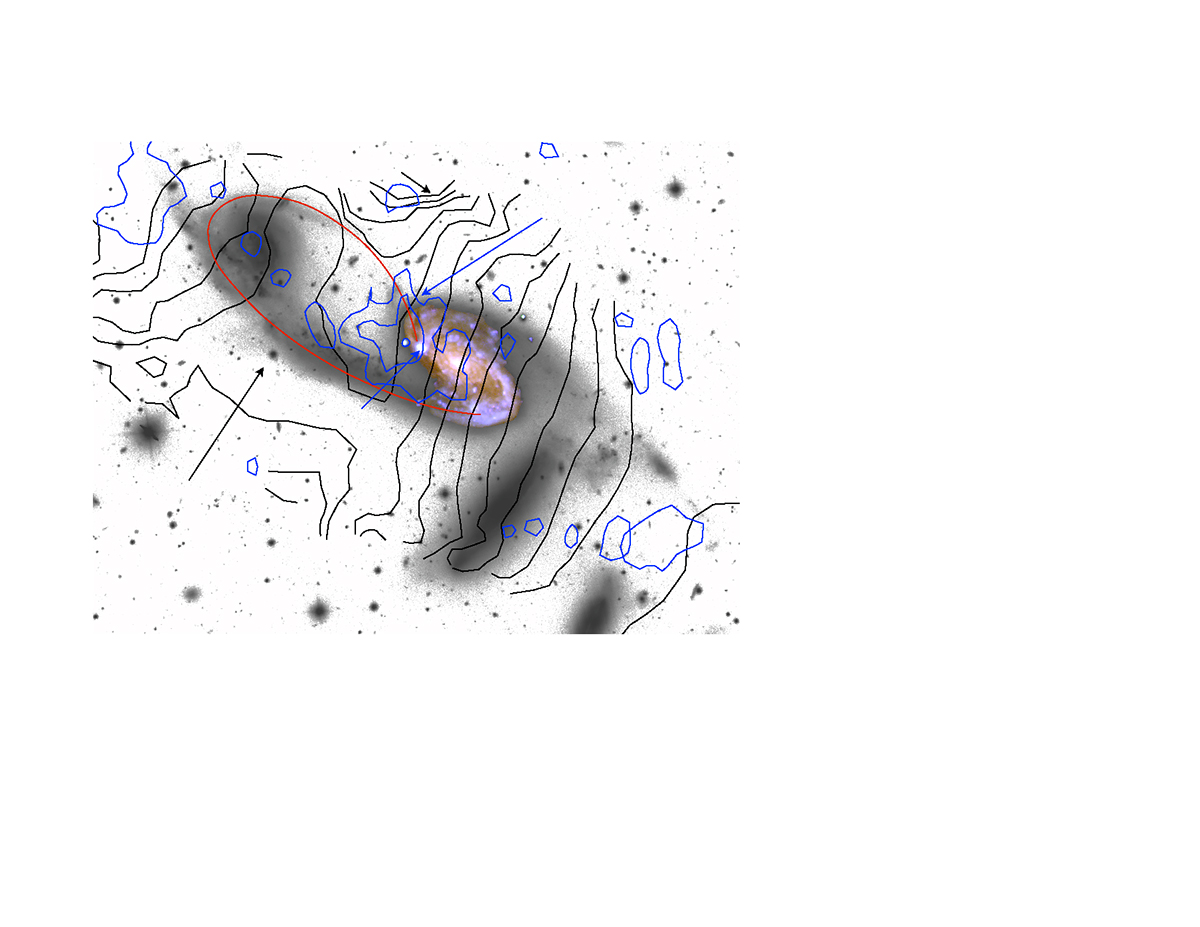
Gemini/GMOS r′-band of NGC 6845. The black contours show the isovelocities analyzed by Gordon et al. 2003. The blue contours indicate the H I distribution at the velocity of 6152 km s−1, as shown in Fig. 2 of Gordon et al. 2003. The red line shows the position of the optical tidal tail of NGC 6845A.
Current usage metrics show cumulative count of Article Views (full-text article views including HTML views, PDF and ePub downloads, according to the available data) and Abstracts Views on Vision4Press platform.
Data correspond to usage on the plateform after 2015. The current usage metrics is available 48-96 hours after online publication and is updated daily on week days.
Initial download of the metrics may take a while.