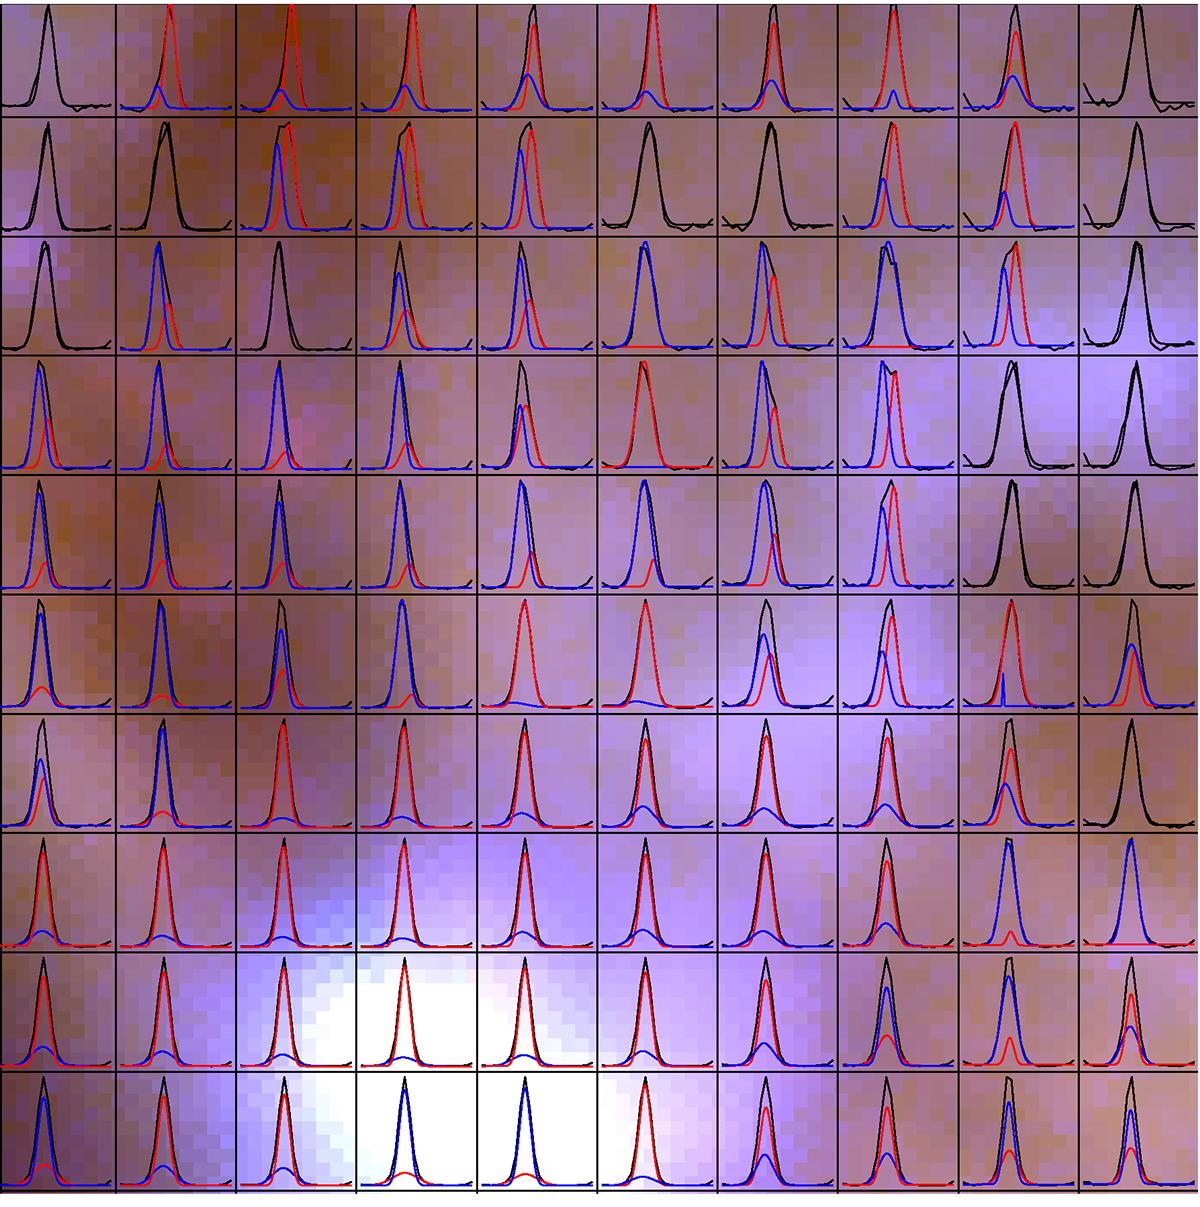
Fig. 10.
Download original image
Hα profiles in the region of the hinge clump. Each box represents an angular size of 1 arcsec, where the emission profile was integrated in this area. Asymmetric and double profiles can be identified at the north of the hinge clump ID26. We fit two Gaussians profiles on the observed emission, which are represented by blue and red profiles on each spaxel. North of the hinge clump, these components have a velocity difference of about 160 km s−1.
Current usage metrics show cumulative count of Article Views (full-text article views including HTML views, PDF and ePub downloads, according to the available data) and Abstracts Views on Vision4Press platform.
Data correspond to usage on the plateform after 2015. The current usage metrics is available 48-96 hours after online publication and is updated daily on week days.
Initial download of the metrics may take a while.