Fig. 8
Download original image
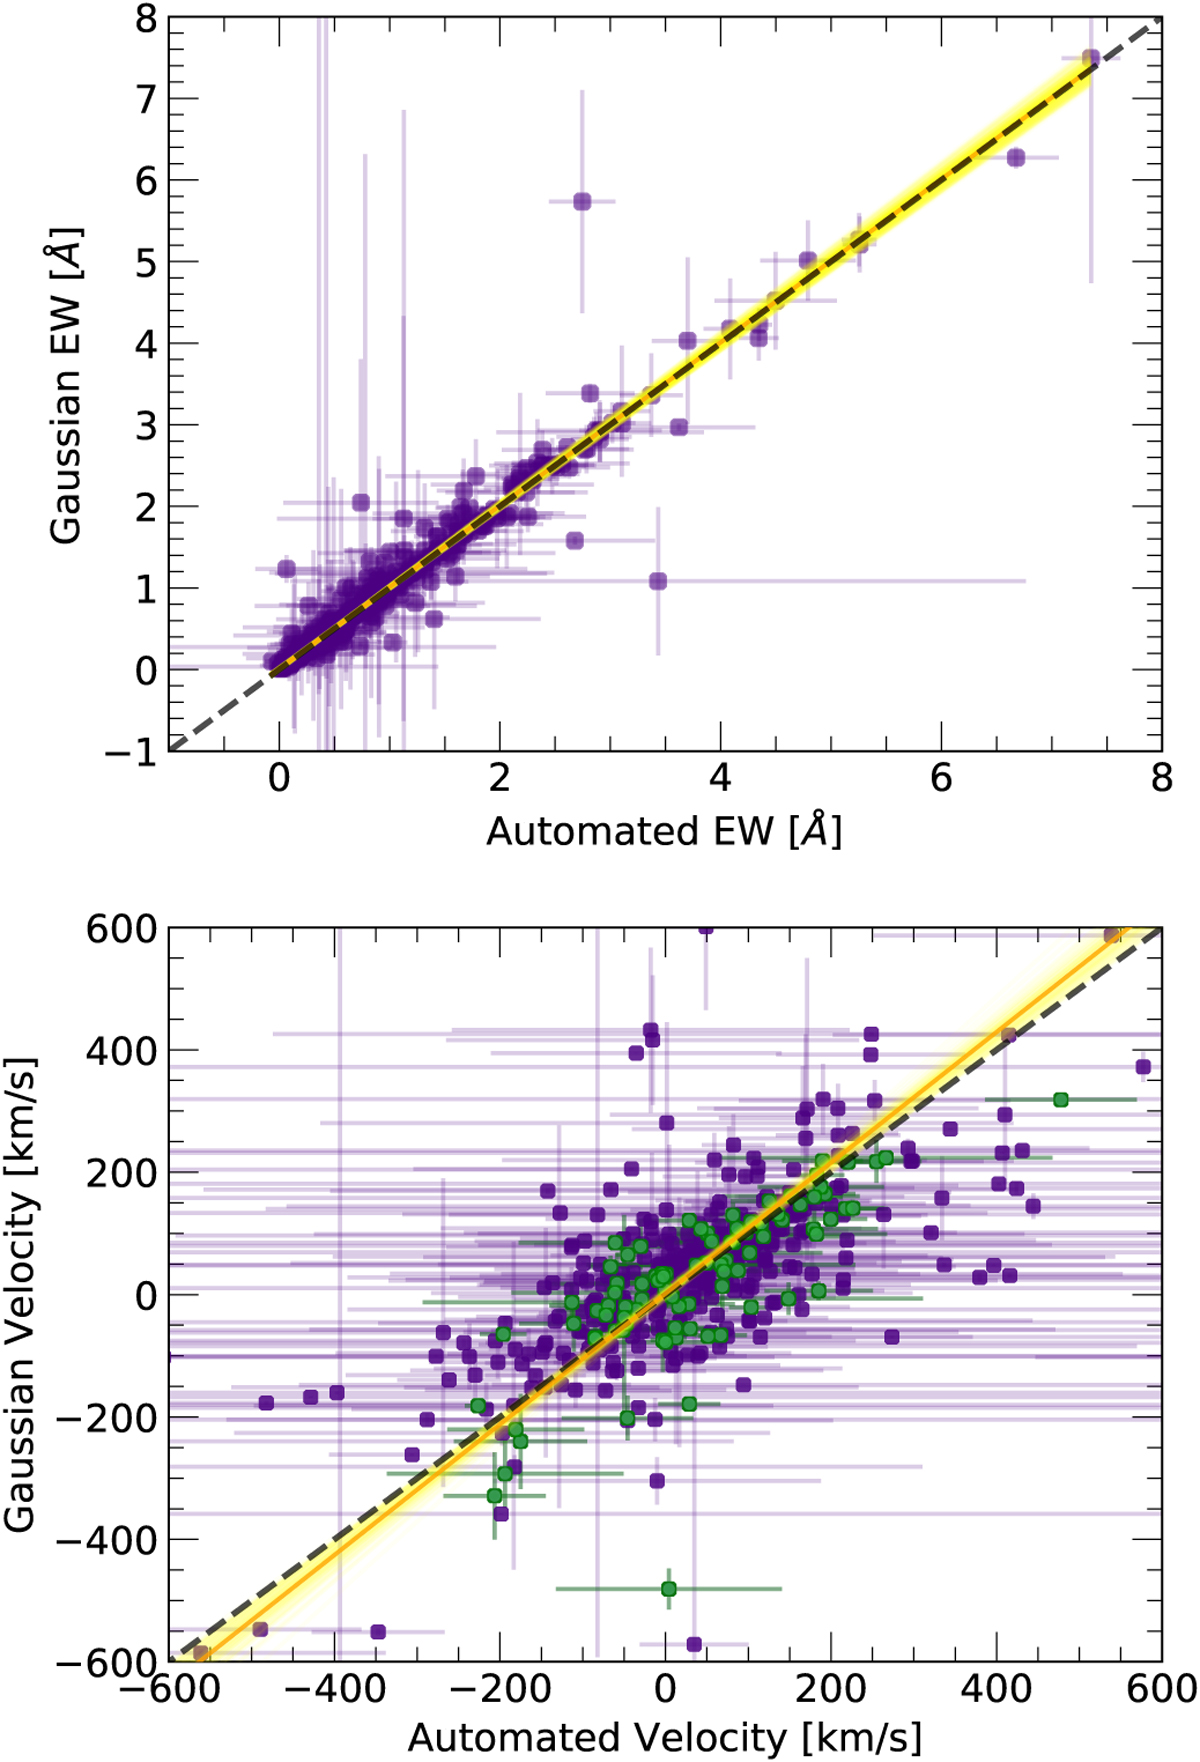
Comparison of EWs (top) and velocities (bottom) measured with the automated technique and a double Gaussian fit for Na I D with the wavelength separation fixed. Each plot shows the corresponding best linear MCMC fit (LINMIX_ERR; Kelly 2007) as a solid orange line and the variance with respect to the fit line in yellow. The x = y line is indicated in dashed green lines. In the bottom plot, the green points show that cases for which the EW/τEW > 1.3 and EW > 0.5 have lower uncertainties and agree better within the two methods. The uncertainties here do not include the uncertainty floor of 35 km s−1.
Current usage metrics show cumulative count of Article Views (full-text article views including HTML views, PDF and ePub downloads, according to the available data) and Abstracts Views on Vision4Press platform.
Data correspond to usage on the plateform after 2015. The current usage metrics is available 48-96 hours after online publication and is updated daily on week days.
Initial download of the metrics may take a while.