Fig. 6
Download original image
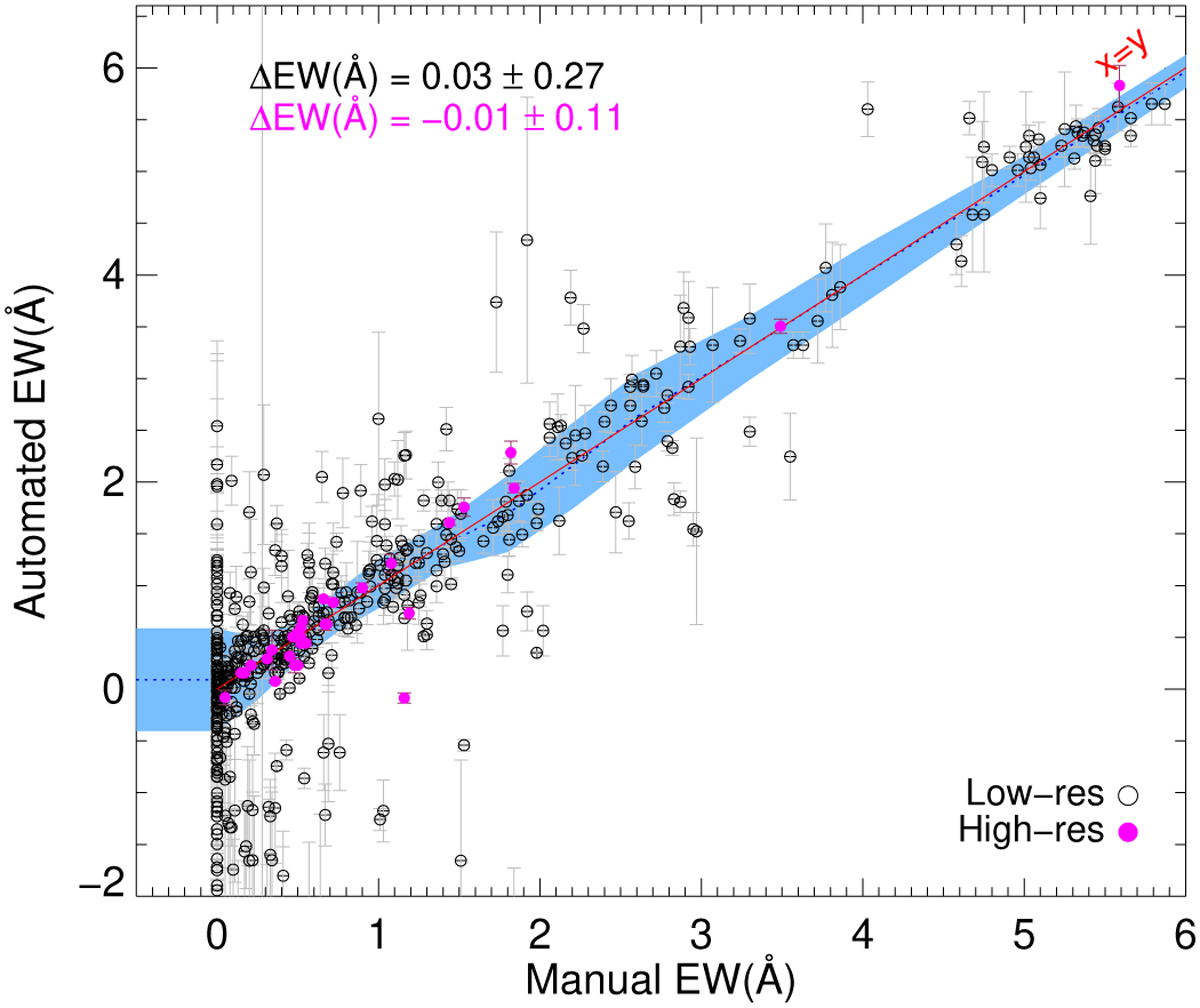
Comparison of the EW of Na I D doublet measured manually and with our automatic software for a sub-sample of 1145 low-resolution spectra (empty circles) and 32 high-resolution spectra (purple circles). The red line shows a x = y match. The blue-shaded area represents the median scatter between the two measurements per EW bin. The median and deviation of the Ml sample are indicated at the top of the plot. The median error from the automatic method is 0.11 Å. Below zero in the manual measurement, we show in blue the median and absolute median deviation, −0.04 ± 0.47 Å, of the automated measurements for spectra where no line was found visually.
Current usage metrics show cumulative count of Article Views (full-text article views including HTML views, PDF and ePub downloads, according to the available data) and Abstracts Views on Vision4Press platform.
Data correspond to usage on the plateform after 2015. The current usage metrics is available 48-96 hours after online publication and is updated daily on week days.
Initial download of the metrics may take a while.