Fig. 5
Download original image
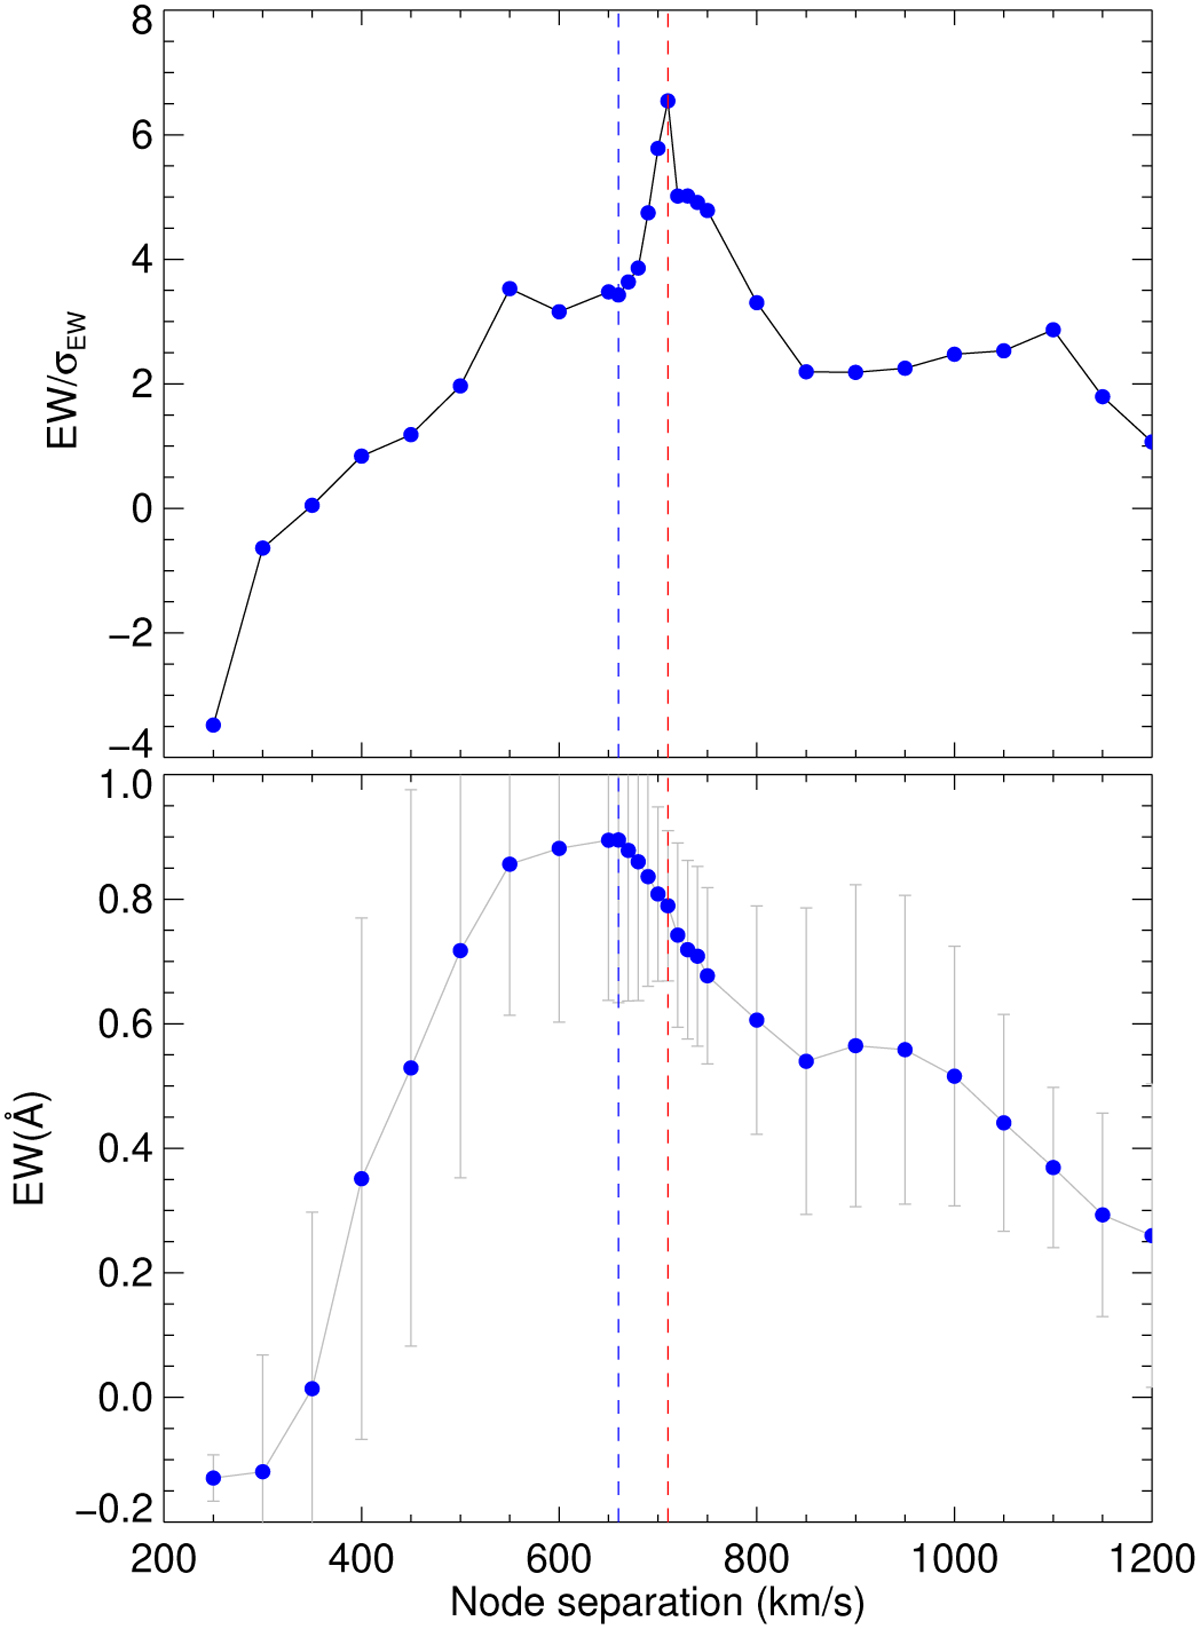
Measured equivalent width, EW, over measured uncertainty, σEW (top), and equivalent width (bottom) for a spectrum of SN 2014J around the K I 7665 Å (see Fig. C.2) as a function of the node separation defining the continuum. The maximum EW is shown with a vertical dashed blue line, whereas the maximum |EW|/σEW is shown with a red line.
Current usage metrics show cumulative count of Article Views (full-text article views including HTML views, PDF and ePub downloads, according to the available data) and Abstracts Views on Vision4Press platform.
Data correspond to usage on the plateform after 2015. The current usage metrics is available 48-96 hours after online publication and is updated daily on week days.
Initial download of the metrics may take a while.