Fig. 4
Download original image
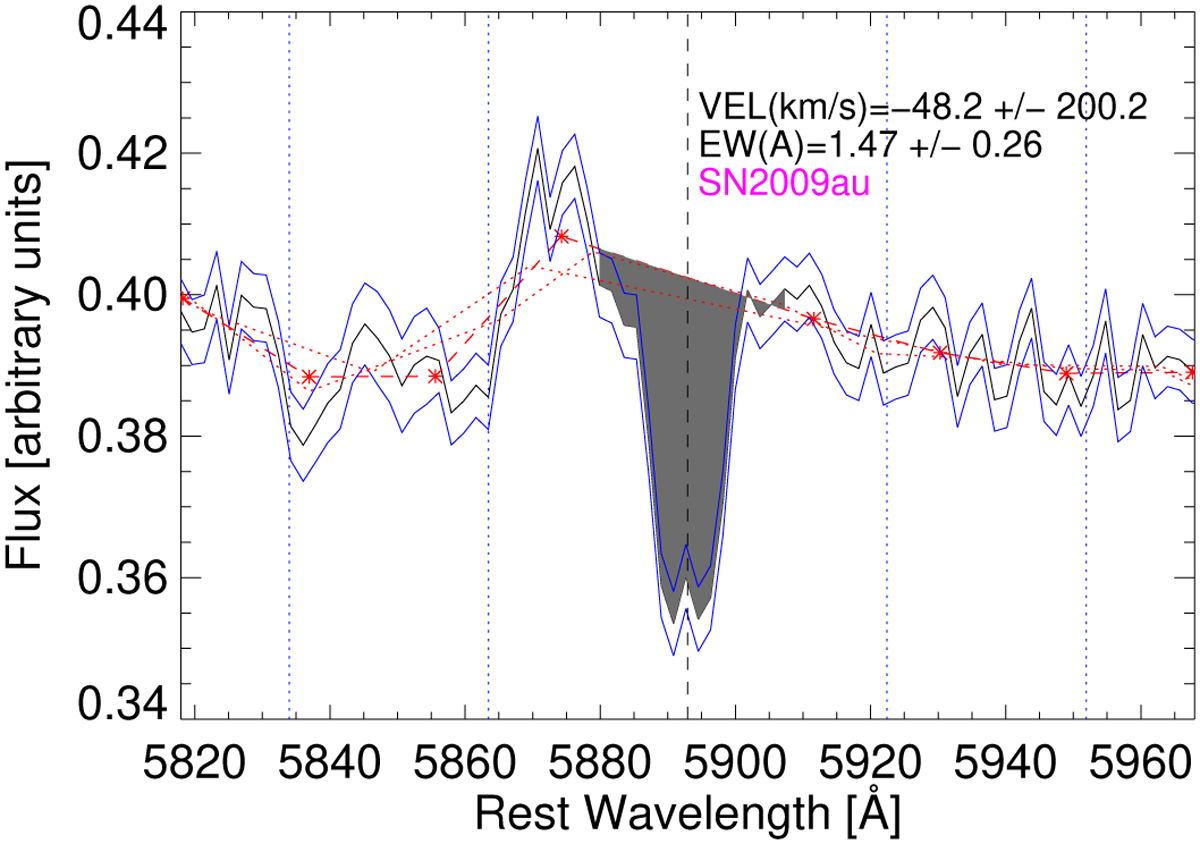
SN 2009au (SN II) spectrum around the Na I D lines. The black line is the spectrum, the blue lines are the estimated flux errors, the red stars are the nodes, and the dashed red line is the continuum crossing the nodes. Dotted red lines represent the continua at ±25% of the node separation being considered. The grey-shaded area is the integrated line within ±1000 km s−1. The dashed black vertical line is the central wavelength of the line. The other vertical dotted blue lines indicate other wavelengths where we measured EW and whose dispersion provides a systematic uncertainty.
Current usage metrics show cumulative count of Article Views (full-text article views including HTML views, PDF and ePub downloads, according to the available data) and Abstracts Views on Vision4Press platform.
Data correspond to usage on the plateform after 2015. The current usage metrics is available 48-96 hours after online publication and is updated daily on week days.
Initial download of the metrics may take a while.