Fig. C.5
Download original image
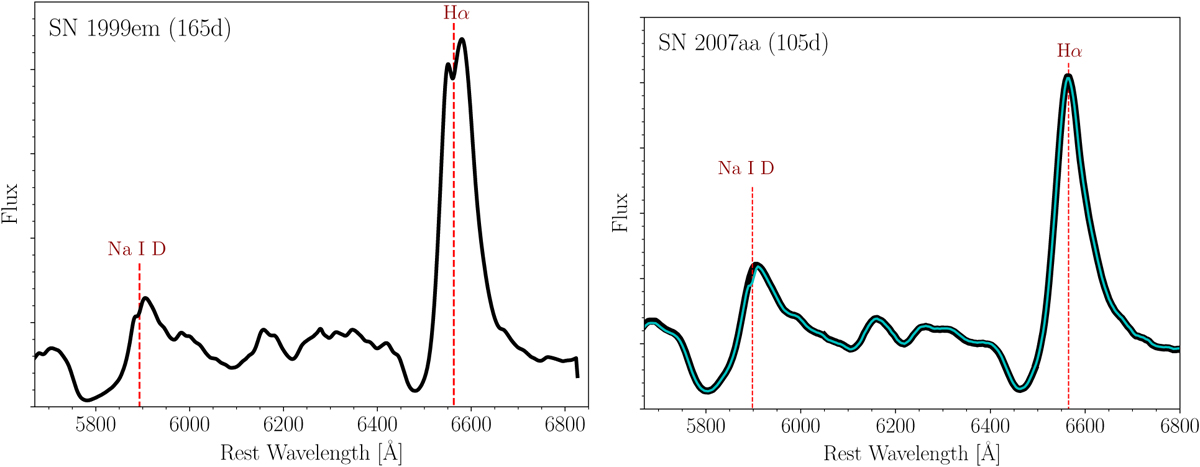
Observed spectra (black) of SN 1999em (left) and 2007aa (right) at 165 and 105 days from the explosion. The vertical dashed lines show the rest-frame position of the strongest lines. The simulated spectrum of SN 2007aa, where a fake Na I D narrow line was added at λ = 5893 Å (EW= 1.1 Å), is presented on top of the observed spectrum (cyan). The peak of the Na I D seems redshifted in SN 1999em, compared to Hα, which is at the rest-position. A comparable shift can be obtained when a narrow line is located on the top of the broad SN P-Cygni line of SN 2007aa.
Current usage metrics show cumulative count of Article Views (full-text article views including HTML views, PDF and ePub downloads, according to the available data) and Abstracts Views on Vision4Press platform.
Data correspond to usage on the plateform after 2015. The current usage metrics is available 48-96 hours after online publication and is updated daily on week days.
Initial download of the metrics may take a while.