Fig. 23
Download original image
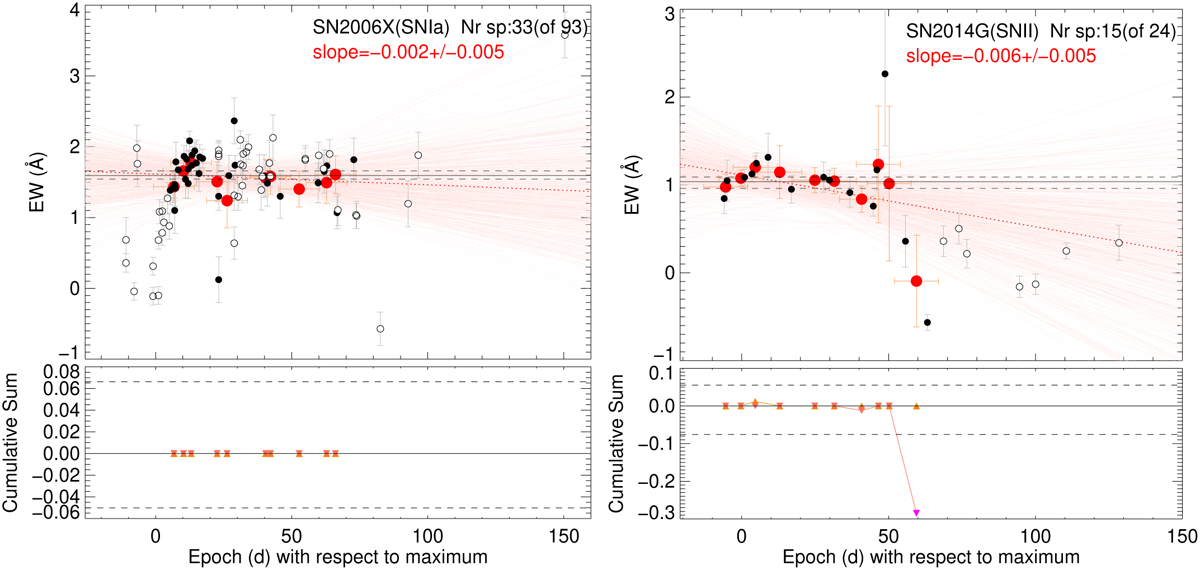
Top: Na I D EW evolution for SN 2006X (left) and SN 2014G (right) before and after cuts (empty and filled black points, respectively) and stacked measurements of points after culls in intervals of 15 days requiring minimum two spectra (red points). Horizontal lines indicate the stacked EW and error from all spectra that passed the cuts. A Bayesian linear fit to the red points is shown with light red lines (1000 realizations) and a corresponding median with a dotted red line. The resulting slope is negative with 68.7 and 93.7% probability, respectively for both SNe. Bottom: cumulative deviation analysis above/below (upper/lower triangles) the stacked EW (corresponding to the zero horizontal line) and its associated errors (dashed lines). Significant points are shown in purple.
Current usage metrics show cumulative count of Article Views (full-text article views including HTML views, PDF and ePub downloads, according to the available data) and Abstracts Views on Vision4Press platform.
Data correspond to usage on the plateform after 2015. The current usage metrics is available 48-96 hours after online publication and is updated daily on week days.
Initial download of the metrics may take a while.