Fig. 22
Download original image
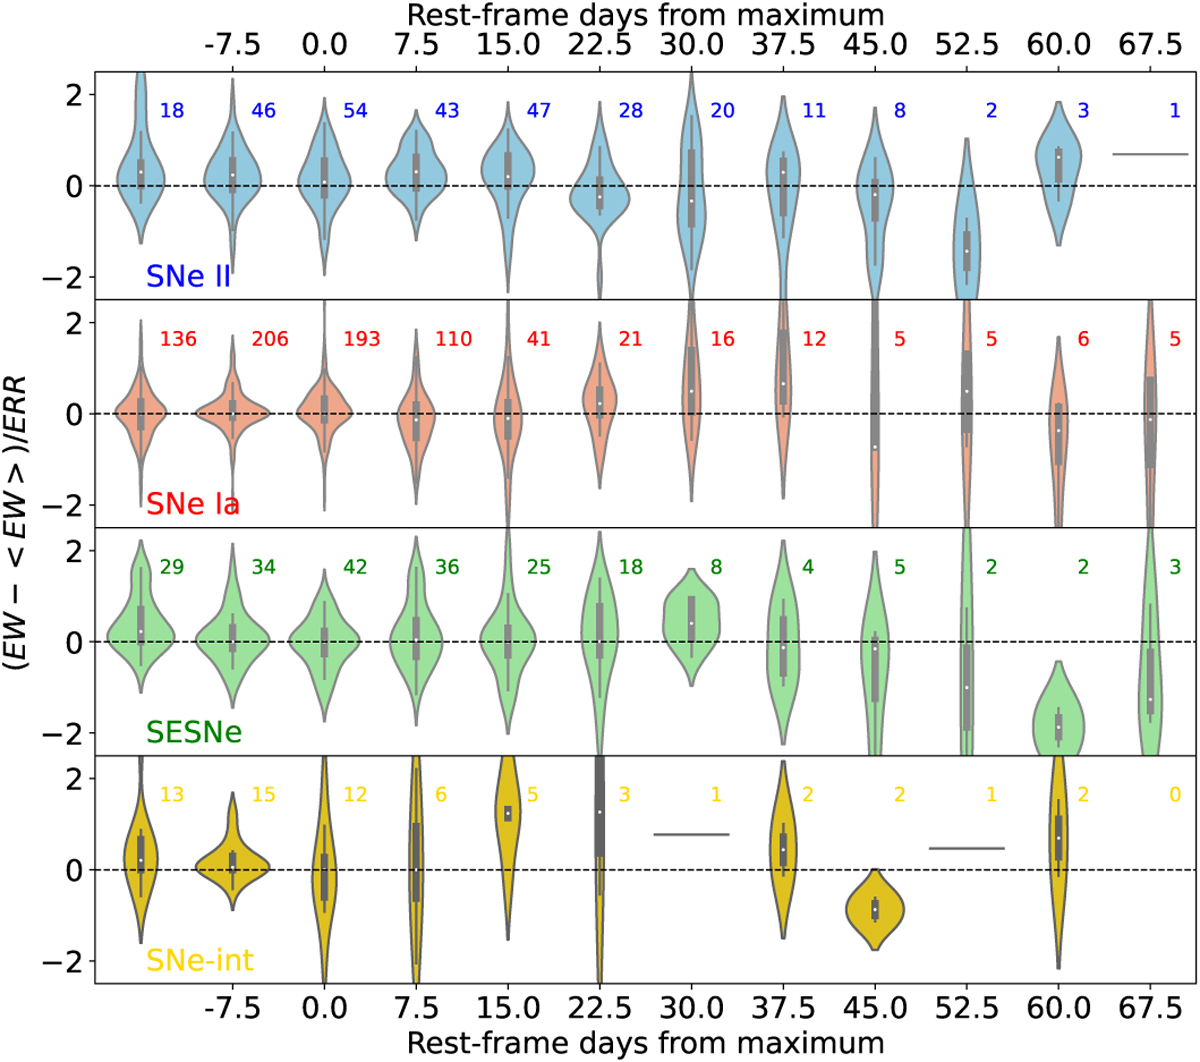
Na I D violin plots of the Na I D EW evolution for each SN type (from top to bottom: SNe II, SNe Ia, SESNe, and SNe-int) showing the mean and extreme of the distribution (white point in the box and edges of central vertical lines) and a kernel density probability estimation (coloured area). The number of SNe within each distribution at each epoch is indicated above each bin. We require at least two spectra per SN in intervals of 15 days for stacked EW measurements.
Current usage metrics show cumulative count of Article Views (full-text article views including HTML views, PDF and ePub downloads, according to the available data) and Abstracts Views on Vision4Press platform.
Data correspond to usage on the plateform after 2015. The current usage metrics is available 48-96 hours after online publication and is updated daily on week days.
Initial download of the metrics may take a while.