Fig. 21
Download original image
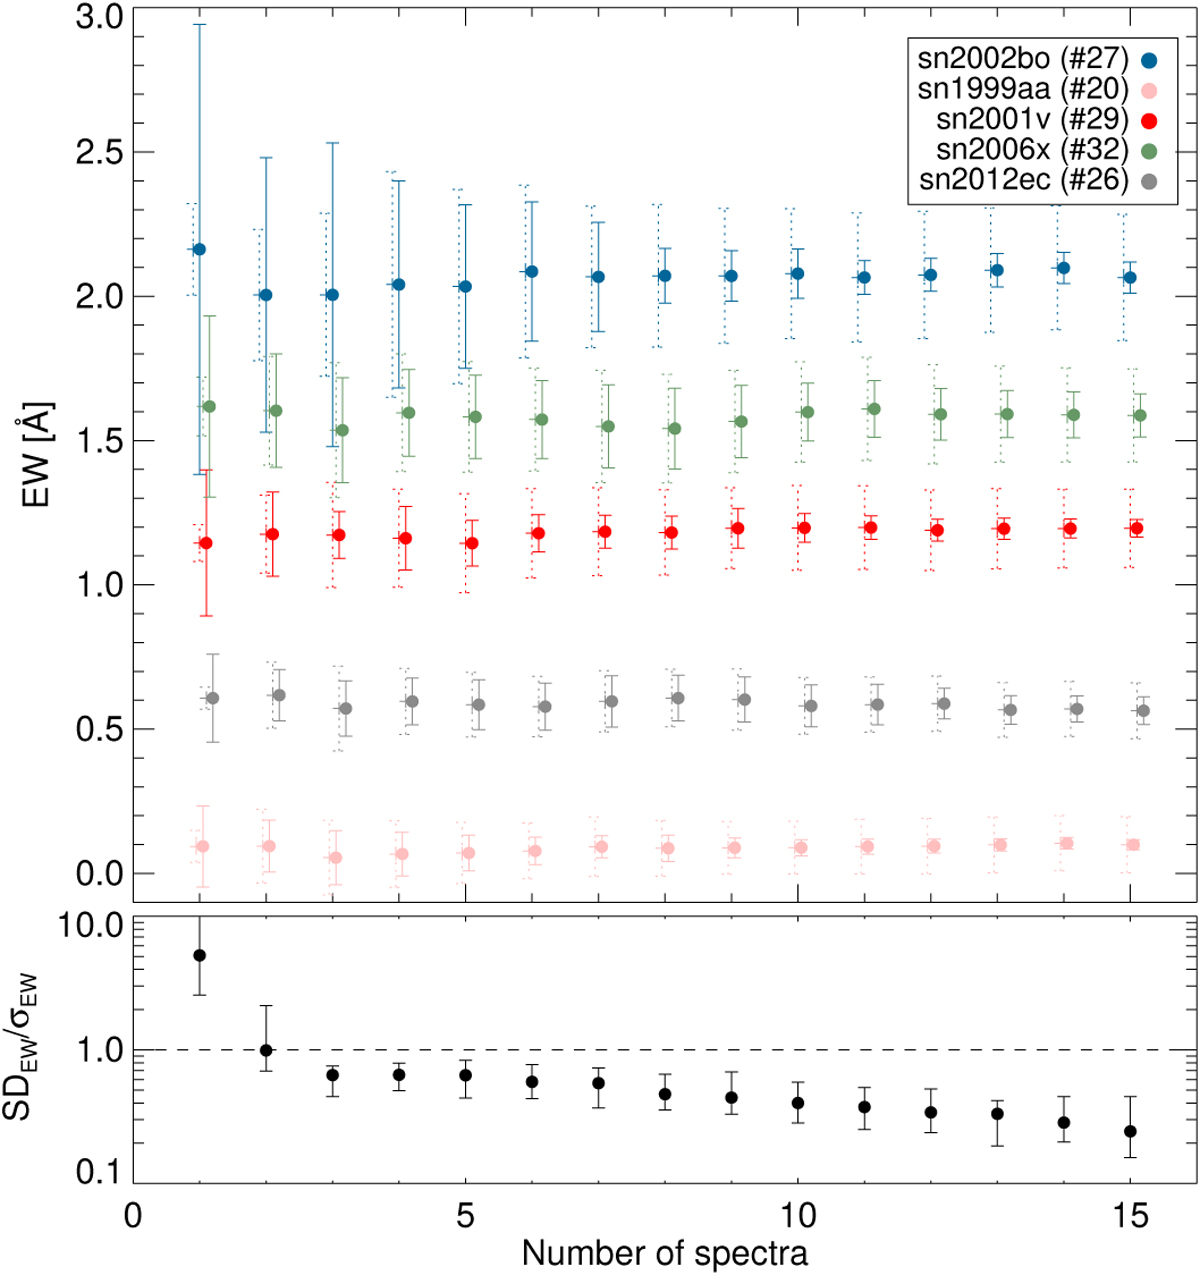
Top: median and standard deviation of equivalent width measurements from multiple spectra randomly taken from the numerous sets of spectra of five SNe: SN l999aa, SN 2001V, SN 2002bo, SN 2006X, and SN 2012ec, as a function of the number of spectra used for the measurement. The solid error bars represent the standard deviation, while the dashed error bars are the median error calculated by the automated technique. Bottom: average ratio of the standard deviation to the calculated uncertainty from the automated technique for nearly 30 SNe with more than ten spectra. The error bars show the dispersion.
Current usage metrics show cumulative count of Article Views (full-text article views including HTML views, PDF and ePub downloads, according to the available data) and Abstracts Views on Vision4Press platform.
Data correspond to usage on the plateform after 2015. The current usage metrics is available 48-96 hours after online publication and is updated daily on week days.
Initial download of the metrics may take a while.