Fig. 18
Download original image
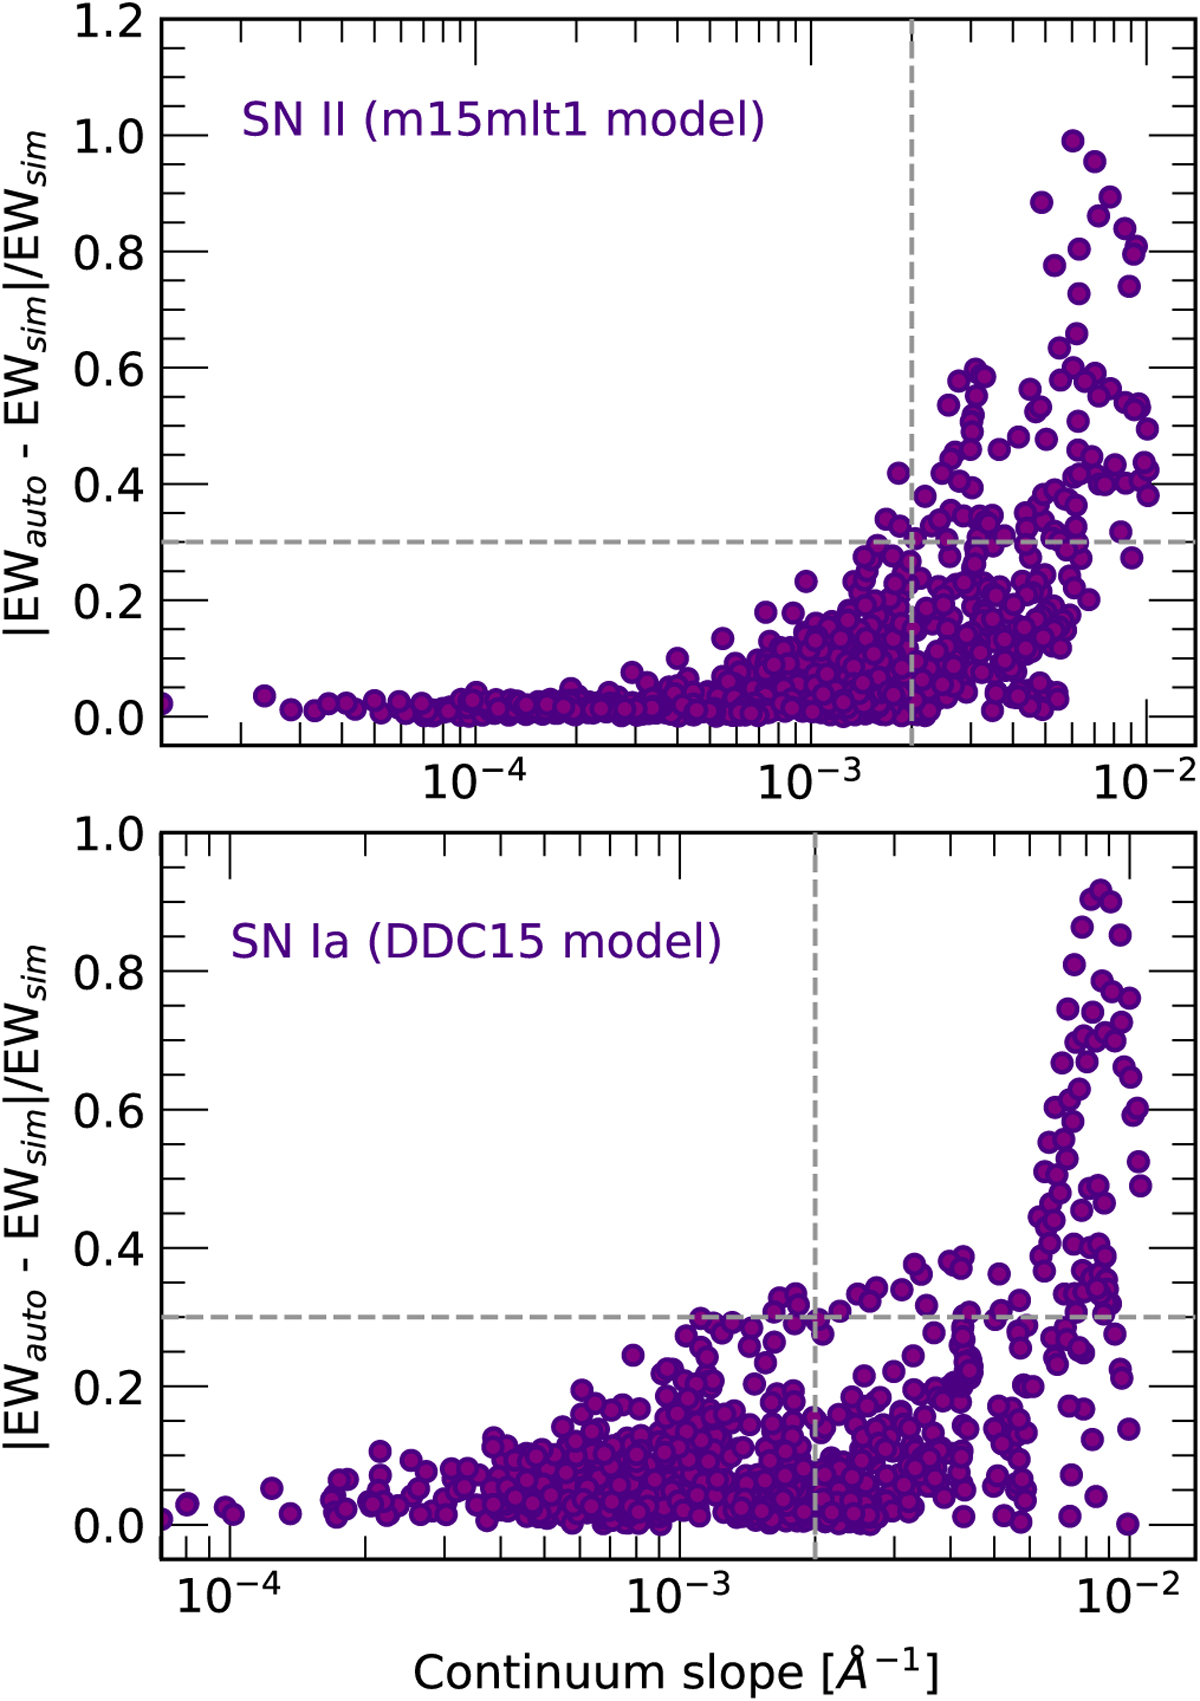
Fractional residual of measured EW to simulated EW (|EWauto– EWsim|/EWsim) as a function of the continuum slope around the Na I D line for simulated spectra of SNe II (top) and SNe Ia (bottom). EW measurements include simulated line-oſ-sight Na I D lines at six different positions around the central wavelength and for three different simulated narrow EW strengths. The vertical dashed line is our adopted cut to eliminate spectra with too large a continuum slope, i.e. a big underlying broad line profile, eliminating cases with more than 30% residuals (horizontal dashed lines).
Current usage metrics show cumulative count of Article Views (full-text article views including HTML views, PDF and ePub downloads, according to the available data) and Abstracts Views on Vision4Press platform.
Data correspond to usage on the plateform after 2015. The current usage metrics is available 48-96 hours after online publication and is updated daily on week days.
Initial download of the metrics may take a while.