Open Access
Fig. 17
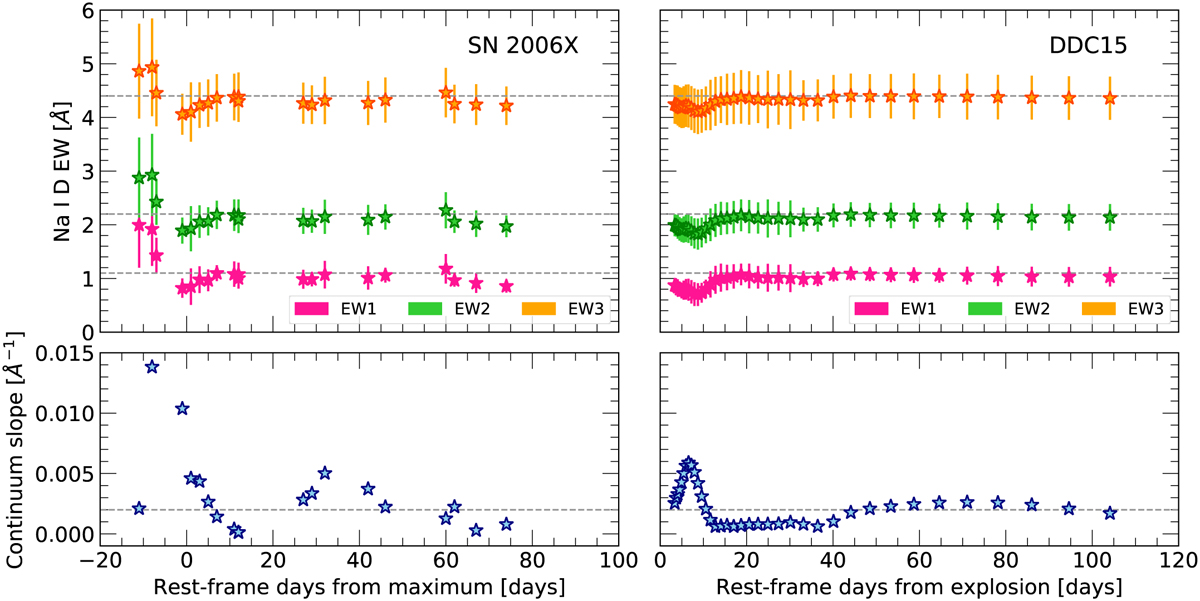
Download original image
Same as Fig. 15, but for SNe Ia. Simulated narrow Na I D lines on top of the observed spectra of SN 2006X (left) and on top of the modelled spectra of Blondin et al. (2015) (right).
Current usage metrics show cumulative count of Article Views (full-text article views including HTML views, PDF and ePub downloads, according to the available data) and Abstracts Views on Vision4Press platform.
Data correspond to usage on the plateform after 2015. The current usage metrics is available 48-96 hours after online publication and is updated daily on week days.
Initial download of the metrics may take a while.