Fig. 15
Download original image
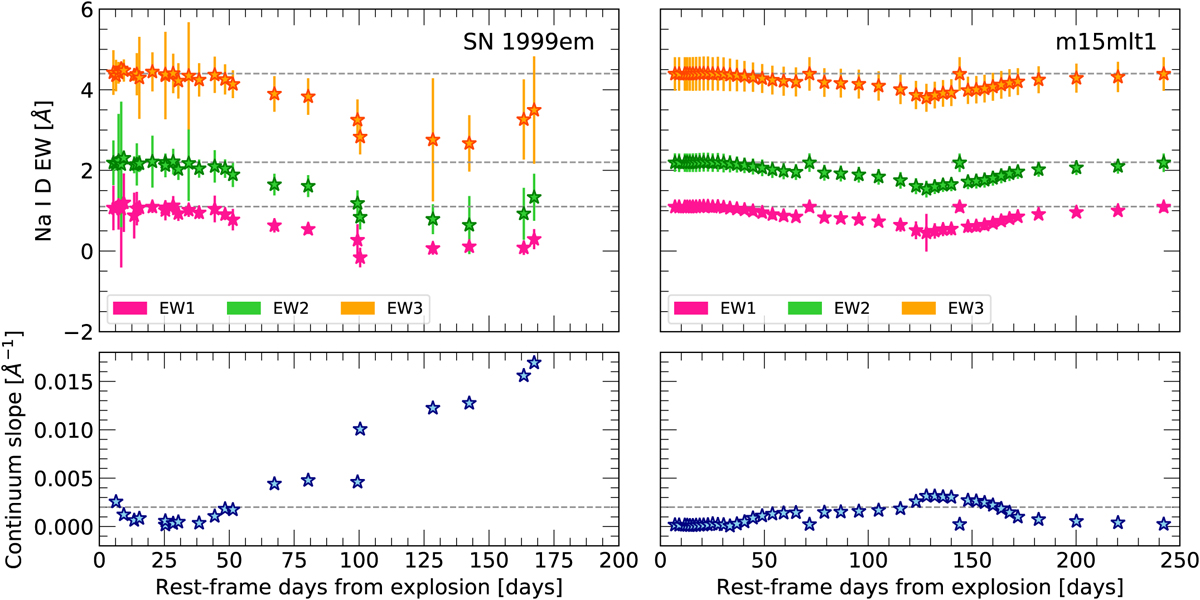
EW measurements for simulated intervening Na I D lines located at a rest frame (ɀ0 = 5893 Å) on top of real sodium P-Cygni profiles from observed spectra of SN 1999em (left) and on top of simulated spectra of Dessart & Hillier (2011) (right). Horizontal lines show the EW expected from the simulated narrow Na I D line: EW1 = 1.1 Å, EW2 = 2.2 Å, and EW3 = 4.4 Å. The measured continuum slope at around 5893 Å is presented in the bottom panel. The horizontal line shows the cut applied in this study: a maximum continuum slope value of 0.002 Å−1.
Current usage metrics show cumulative count of Article Views (full-text article views including HTML views, PDF and ePub downloads, according to the available data) and Abstracts Views on Vision4Press platform.
Data correspond to usage on the plateform after 2015. The current usage metrics is available 48-96 hours after online publication and is updated daily on week days.
Initial download of the metrics may take a while.