Open Access
Fig. 13
Download original image
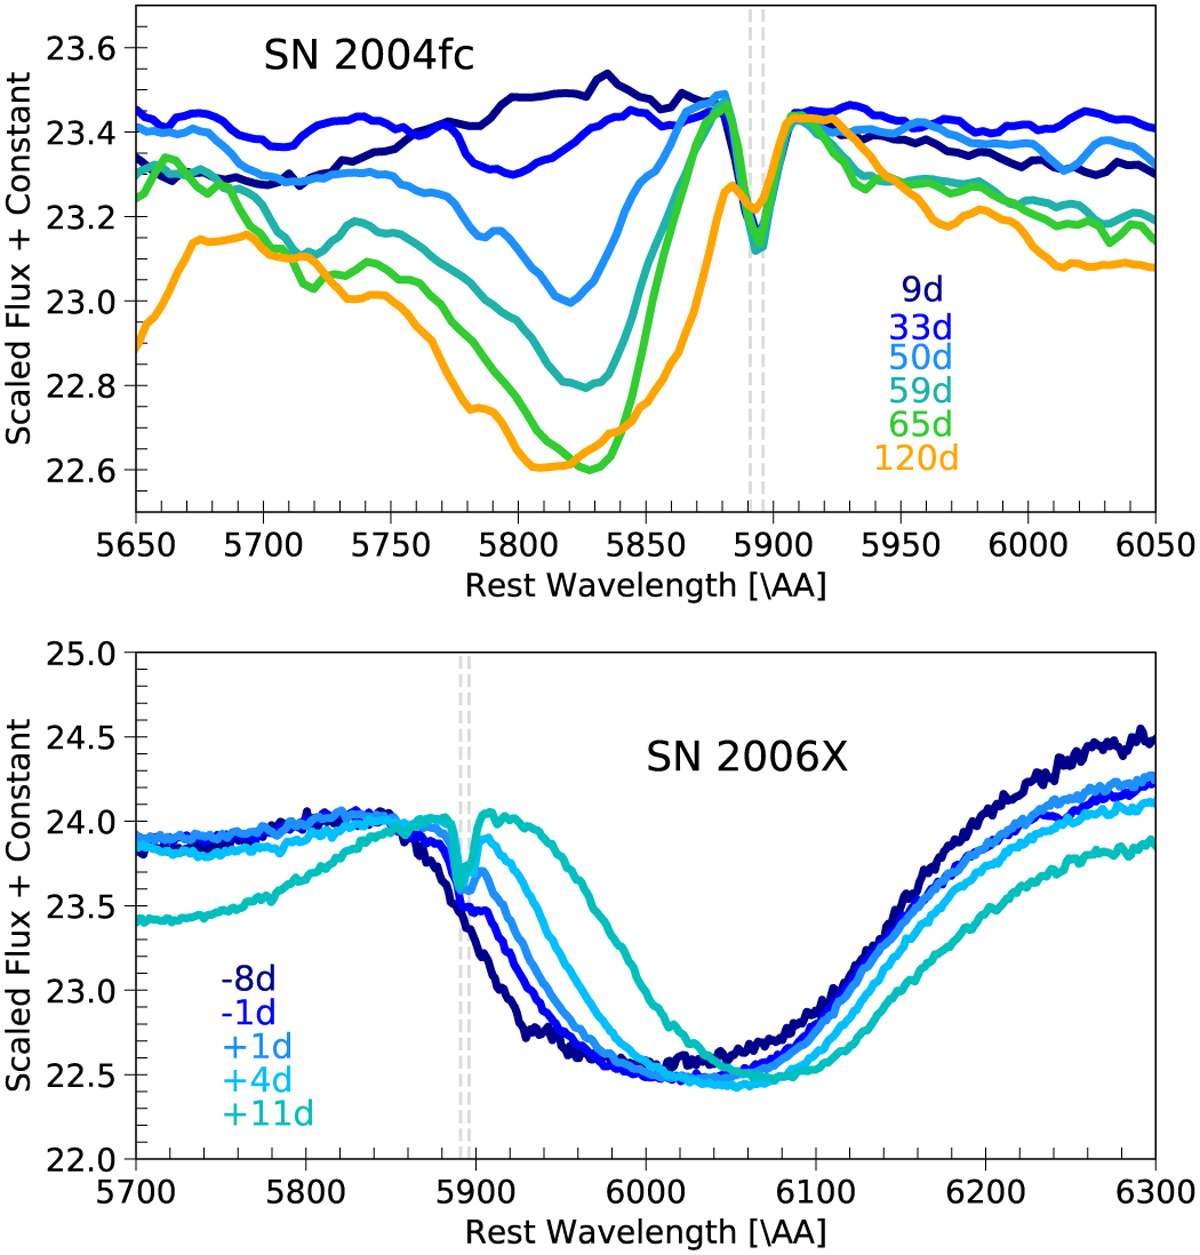
Optical spectral evolution of SN II 2004fc (top) and SN Ia 2006X (bottom) around the Na I D doublet. An apparent evolution of the narrow line is seen for both cases that coincide with the P-Cygni profile evolution of Na I D at the left of the narrow line and of Si II at the right of the narrow line, respectively.
Current usage metrics show cumulative count of Article Views (full-text article views including HTML views, PDF and ePub downloads, according to the available data) and Abstracts Views on Vision4Press platform.
Data correspond to usage on the plateform after 2015. The current usage metrics is available 48-96 hours after online publication and is updated daily on week days.
Initial download of the metrics may take a while.