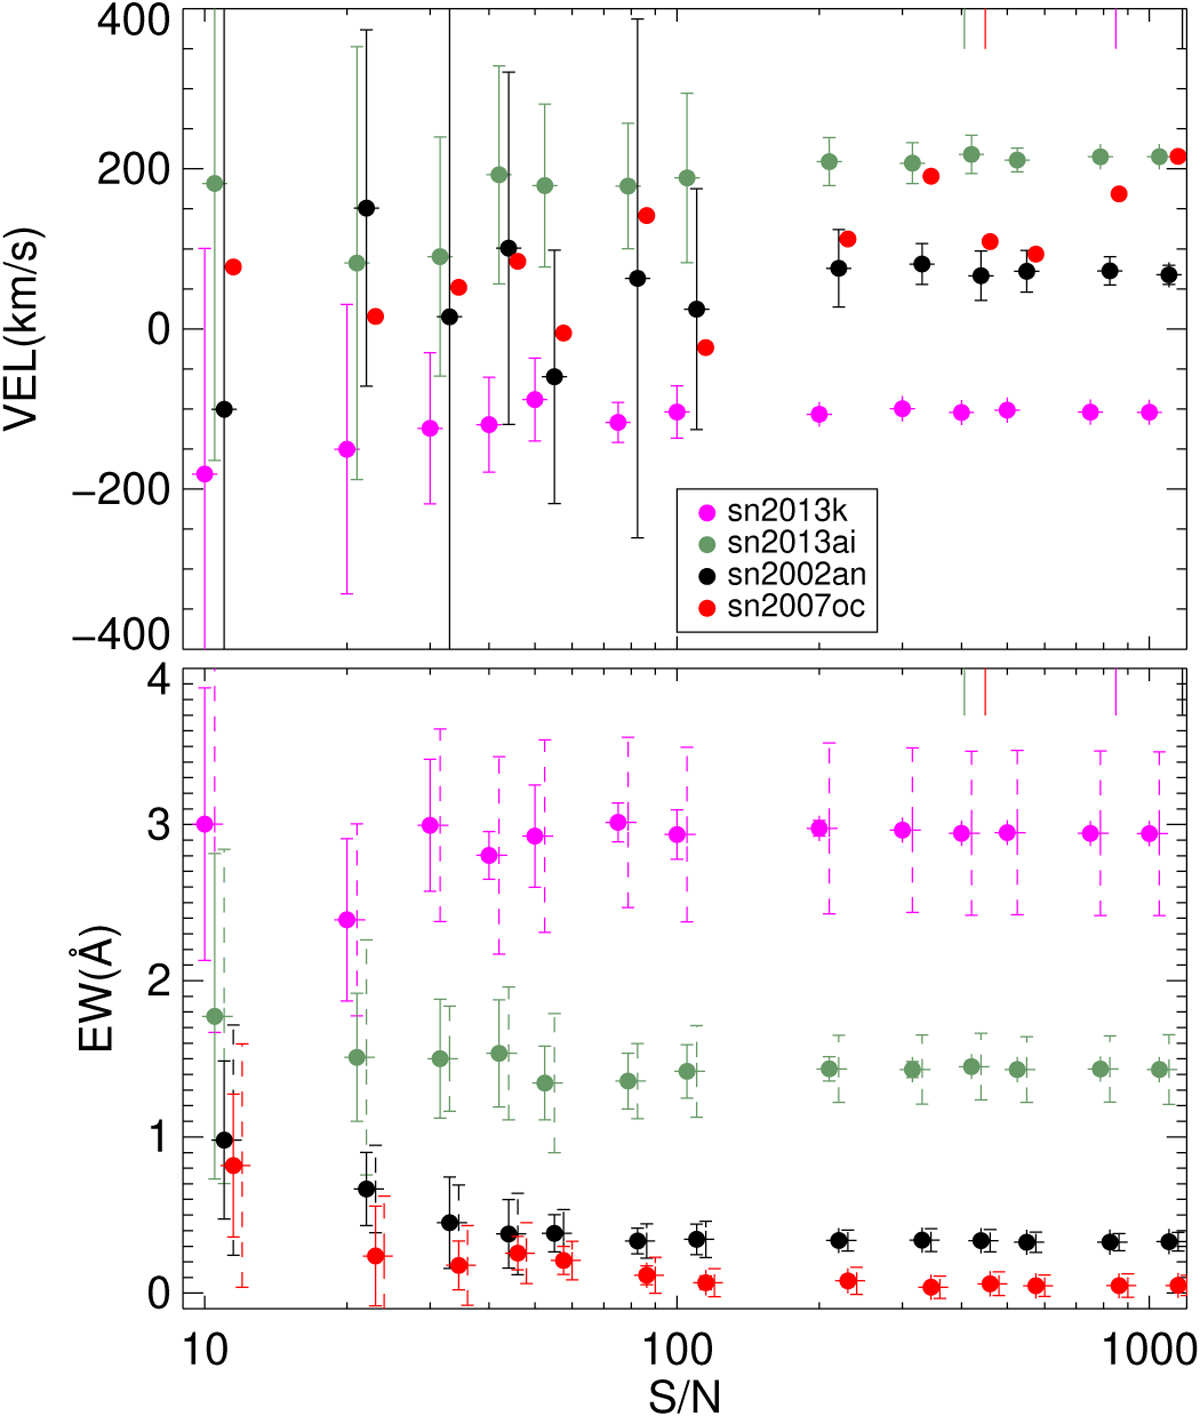
Fig. 12
Download original image
Measured EW (bottom) and velocity (top) as a function of the S/N for the perturbed SN 2002an spectra shown in Fig. C.4 (black) and also for perturbed spectra of SN 2013K (purple), SN 20l3ai (green), and SN 2007oc (red). The points are the mean of ten different simulations for a given S/N, and its associated error bars are the standard deviations (SN 2007oc has too large errors on the velocities and are thus not shown). The dashed error bars of the EW are the mean of the errors calculated from the automated technique. Upper right ticks show the S/N of the original unperturbed spectra.
Current usage metrics show cumulative count of Article Views (full-text article views including HTML views, PDF and ePub downloads, according to the available data) and Abstracts Views on Vision4Press platform.
Data correspond to usage on the plateform after 2015. The current usage metrics is available 48-96 hours after online publication and is updated daily on week days.
Initial download of the metrics may take a while.