Fig. 1
Download original image
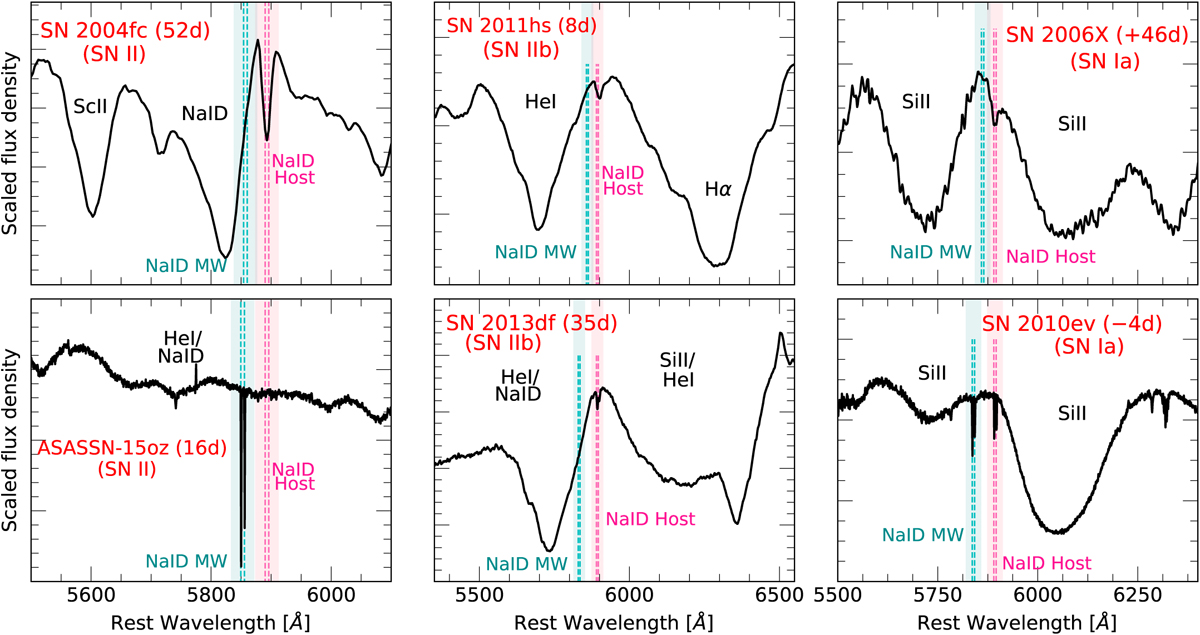
Location of the narrow Na I D absorption lines in SNe II (left), SESNe (middle), and SNe Ia (right panel). The names and phases with respect to the B-band maximum in their observed light curves are marked in each inset. Low-resolution spectra are presented in the top panels (pseudo-resolution – see Sect. 3 – of Rp = 1951, 3087 and 3869 from left to right), while higher-resolution spectra (Rp = 11 877, 9306 and 14 879 from left to right) are at the bottom. The vertical dashed lines indicate the position of the Na I D for the MW (cyan) and the host galaxy (magenta), with the integration window of ±1000 km s−1 shown in shaded areas.
Current usage metrics show cumulative count of Article Views (full-text article views including HTML views, PDF and ePub downloads, according to the available data) and Abstracts Views on Vision4Press platform.
Data correspond to usage on the plateform after 2015. The current usage metrics is available 48-96 hours after online publication and is updated daily on week days.
Initial download of the metrics may take a while.