Open Access
Fig. 17
Download original image
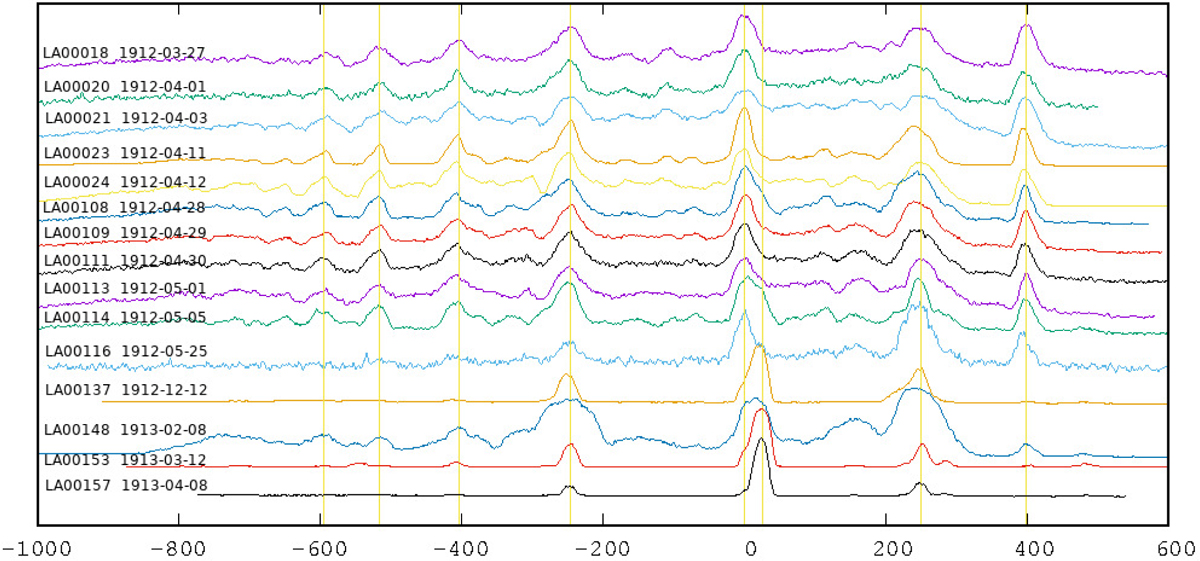
Fifteen shell spectra of Nova Gem 1912, background subtracted, scaled and shifted to H-gamma at pixel position “0” and arbitrarily in y-direction ordered by date from top to bottom. The strongest emission line features are marked by vertical lines. Note: the wavelength scale is non-linear. Adapted from Groote (2014, 2018).
Current usage metrics show cumulative count of Article Views (full-text article views including HTML views, PDF and ePub downloads, according to the available data) and Abstracts Views on Vision4Press platform.
Data correspond to usage on the plateform after 2015. The current usage metrics is available 48-96 hours after online publication and is updated daily on week days.
Initial download of the metrics may take a while.